Monitoring and reporting on water quality

We conduct health assessments of waterways and work with local councils and other agencies to monitor water quality.

OEH staff testing water quality in the Hunter River.Water quality is usually defined by the physical, chemical, biological and aesthetic (appearance and smell) characteristics of water. Good water quality is essential to the health of our aquatic habitats.

Monitoring water quality tells us whether actions taken to improve water quality have worked. Measuring the effectiveness of previous management enables us to better focus subsequent management.

Monitoring programs can be long- or short-term, and broadscale or local.

Waterway health report cards

We monitor and report on the health of estuaries across New South Wales to help manage and protect these complex ecosystems.

Our scientists:

  • conduct research on estuaries
  • collect and analyse data on estuaries
  • work with local councils to conduct waterway health assessments and help them roll out monitoring programs.

Waterway health is assessed against the Australian and New Zealand Guidelines for Fresh and Marine Water Quality (formerly ANZECC 2000) and Australian River Assessment System (AusRivAS) scores and this information is presented as report cards to the community.

We’ve developed a waterway health report card system that councils can use to present monitoring information they collect,to their local community. It is an easy to understand visual report card system that everyone can use to find out about waterway health, what has been monitored and how waterway health has been maintained and improved.

For example, the Midcoast Council Waterways Report Card 2022. This water quality information can then be used to develop management programs and action plans to ensure water quality is protected.

Our goal is to expand this report card system and establish a state-wide water quality monitoring program through local councils and state agencies.

Waterway health assessment

To assess the health of our waterways we measure indicators or contaminants and characteristics. For example, colour, toxic compounds, micro-organisms, salinity, suspended sediments, and microplastics.

The range of indicators that could be measured to determine water quality is broad and can change.

The cost of a monitoring program to assess all indicators would be prohibitive, so resources are usually directed towards measuring contaminants important for the local environment or for a specific use of the water.

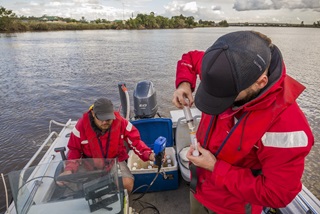
Most water quality testing we do is conducted by our scientists, who collect water samples and analyse them in the laboratory for a range of indicators including nutrients, chlorophyll a, turbidity and macroinvertebrates or bugs.

The results of water sample tests are compared with the recently updated National Water Quality Management Strategy, the Australian and New Zealand Guidelines for Fresh and Marine Water Quality 2018 (formerly ANZECC guidelines) and Australian River Assessment System (AusRivAS) scores, which set out criteria or trigger values that represent acceptable levels for healthy water. When the levels of a contaminant or other indicator exceed these trigger values, this indicates the condition of a waterway is poor.

Health assessments of estuaries are based on analysis of turbidity and algal abundance. We have established trigger values for monitoring estuaries in New South Wales according to estuary type.

Nutrients such as nitrogen and phosphorous are usually present in aquatic habitats, but extra nutrients can contaminate a system. This can cause some plants and microalgae to grow out of control (algal blooms), whereas other plants and animals can decline.

The level of chlorophyll a, a green pigment found in plants, in water samples indicates the amount of microalgae and can indicate an excess of nutrients.

Excess nutrients can reduce:

  • light, which has a negative effect on aquatic vegetation and reduces food and shelter available for aquatic animals
  • oxygen levels, caused when the microalgae die and are broken down by oxygen-consuming bacteria
  • biodiversity.

Our water quality monitoring aims to identify potential sources of excessive nutrients so that we can prevent them from entering waterways.

Turbidity is a measure of how clear water is and is related to the amount of material suspended in water. We measure turbidity in the field and collect water samples to assess for total suspended solids (TSS) back in the lab.

High turbidity or TSS can:

  • restrict the amount of light available for plant growth
  • increase water temperatures
  • decrease dissolved oxygen levels
  • have a negative impact on aquatic ecosystems
  • indicate potential sedimentation (smothering) rates
  • indicate the extent of catchment erosion or other potential contamination sources, such as sewage outfalls or stormwater drains
  • result from urbanisation, clearing of vegetation and agriculture, which can expose soil and increase the amount of material that is washed into our waterways
  • be influenced by rainfall, so rainfall patterns should be considered when analysing turbidity data.

The macroinvertebrates, or bugs, that live in freshwater can indicate past and present conditions of a waterway.

This is based on our knowledge of how tolerant different groups of bugs are to pollution. Some bugs are very sensitive to pollution and their presence indicates that the water quality has been good over the course of their life-span. Other bugs are more tolerant to pollution and their presence, in the absence of more sensitive types can indicate that more long-term, negative impacts are taking place.

One way scientists use the presence of bugs to assess creek condition is by using the Australian River Assessment System (AusRivAS). This system provides a reference condition so that the health of a bug community within a stream can be compared to best-quality sites in New South Wales.