Kangaroo population monitoring and reporting

We monitor kangaroo numbers across New South Wales so that we can establish appropriate quotas for harvesting to maintain ecologically sustainable populations of kangaroos.

Reliable population estimates are fundamental to ensuring the sustainability of the commercial harvest and are used to set the annual harvest quotas. The NSW Government has been researching and monitoring kangaroos under the NSW Kangaroo Management Program since the 1970s. Over this period improvements have been made to the design of surveys to estimate kangaroo population size, based on the best available science.

The 2023 Quota Report – NSW Commercial Kangaroo Management Program details the current survey methods for estimating kangaroo population size across the Northern and Central Tablelands, South East and Western New South Wales.

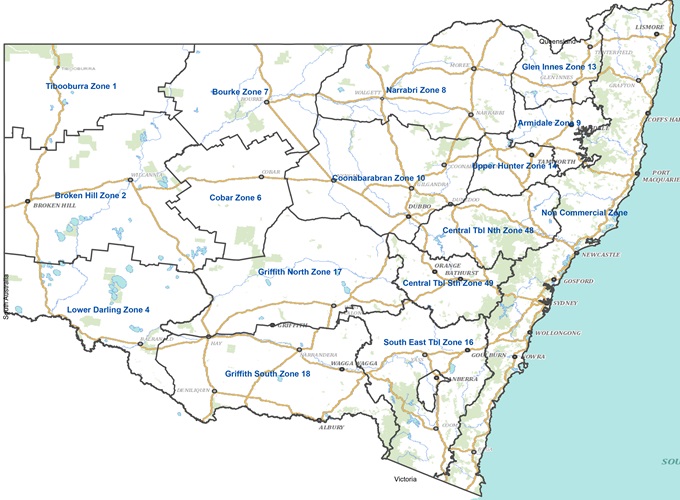
Annual harvest quotas established through population monitoring are allocated across 15 kangaroo management zones.

Kangaroo management zones map

Contact us

Kangaroo Management Program Team

Download

Centre for Research into Ecological and Environmental Modelling (CREEM) Review of survey methods

In response to the NSW Upper House Inquiry into the Health and wellbeing of kangaroos and other macropods, the NSW Government committed to a review of the NSW kangaroo survey design and analysis methods with expert advice from the Centre for Research into Ecological and Environmental Modelling (CREEM), University of St Andrews, [Scotland]. The CREEM review and the department’s response are both available for downloading.

PDF 2MB

Population reports

Tablelands

The NSW Tablelands is divided into 3 broad regions for monitoring populations. These are the Northern Tablelands, Central Tablelands and South East NSW. Each of these regions are surveyed triennially. The Tablelands region consists of 6 kangaroo management zones within which commercial harvesting is administered. Results of Tablelands population surveys are published below.

Northern Tablelands

(Armidale, Glen Innes, Upper Hunter)

Central Tablelands

(Central Tablelands North, Central Tablelands South)

Western Plains

Kangaroo populations on the Western Plains are surveyed annually. These surveys cover 9 kangaroo management zones. Results are used to determine population estimates and administer quota. The Griffith zone was divided into Griffith North and Griffith South in 2019. Results of Western Plains populations surveys are published below. Red and grey kangaroo population estimates by zone for 2010–20. These estimates only apply to the Western Plains.

Red kangaroos – Western Plains – estimates

  Kangaroo management zone
Year Tibooburra Broken Hill Lower Darling Cobar Bourke Narrabri Coonabarabran Griffith Griffith North Griffith South Total
2022 344,350 1,746,169 667,100 183,195 214,369 345,322 197,356 199,456 331,894 4,229,211
2021 336,735 1,281,119 750,367 180,501 164,351 310,030 226,411 284,023 113,125 3,646,662
2020 200,465 1,197,474 583,802 102,480 117,975 190,468 152,052 126,160 253,492 2,924,368
2019 79,346 1,124,115 691,119 36,058 497,085 346,451 500,137 159,545 106,788 3,540,644
2018 344,619 1,133,523 307,619 44,733 244,687 353,348 218,312 284,853 2,931,694
2017 1,135,531 823,210 289,385 229,495 461,968 785,211 588,404 819,450 5,132,654
2016 1,567,598 1,206,597 619,113 437,129 730,140 780,834 421,498 601,325 6,364,234
2015 1,061,784 2,168,733 387,272 357,287 504,671 315,429 505,429 589,282 5,889,886
2014 1,256,418 2,192,347 289,106 298,459 439,559 406,847 590,194 950,341 6,423,271
2013 903,279 1,219,455 423,518 193,738 460,225 369,861 373,924 536,580 4,480,580
2012 937,643 1,138,627 295,180 252,750 429,000 371,257 357,256 366,603 4,148,316
2011 621,124 1,079,052 186,473 210,921 444,932 530,367 343,239 556,415 3,972,522
2010 636,037 855,368 193,930 148,176 251,196 433,365 250,624 245,208 3,013,908

Grey kangaroos – Western Plains – estimates

  Kangaroo management zone
Year Tibooburra Broken Hill Lower Darling Cobar Bourke Narrabri Coonabarabran Griffith Griffith North Griffith South Total
2022 16,510 211,832 340,884 40,278 30,385 289,798 1,042,877 941,071 535,660 3,449,295
2021 30,600 184,257 281,919 68,223 36,462 311,846 1,035,233 682,365 511,201 3,142,106
2020 6,859 281,410 314,639 44,208 41,501 745,775 891,090 421,161 371,796 3,118,439
2019 48,502 326,644 378,718 7,317 51,734 765,632 1,536,291 1,029,202 660,066 4,804,106
2018 184,002 395,360 281,035 81,391 183,950 728,648 1,274,243 919,282 3,981,911
2017 176,058 438,131 212,474 184,069 221,401 445,768 915,211 1,262,635 3,855,747
2016 451,594 672,187 566,970 405,079 473,265 1,434,755 1,089,374 1,241,399 6,334,623
2015 234,927 564,083 360,959 492,207 474,326 813,425 1,836,656 1,476,232 6,252,816
2014 44,669 444,547 397,584 546,338 471,812 1,321,410 2,417,012 1,376,362 7,019,734
2013 163,392 586,534 486,859 660,596 541,622 1,874,886 2,071,115 1,780,269 8,165,273
2012 73,882 221,803 232,187 311,522 446,909 1,246,675 1,457,381 700,388 4,690,747
2011 51,214 179,320 98,973 176,060 128,018 1,229,345 1,089,829 541,306 3,494,063
2010 37,780 241,831 231,585 256,097 140,721 752,770 935,327 562,930 3,159,044