Brisbane Water

We collaborate with local government to monitor the condition of Brisbane Water. Find out more about the Brisbane Water estuary and its unique features.

Brisbane Water is situated on the central coast of New South Wales north of Sydney. It is classed as a lake, and its untrained entrance at Broken Bay is permanently open to the ocean.

The estuary comprises a series of creeks, lakes, channels and islands that support a large range of biodiverse habitats. The estuary also has high recreational value because of its proximity to dense urban areas.

Estuary health and features

Water quality

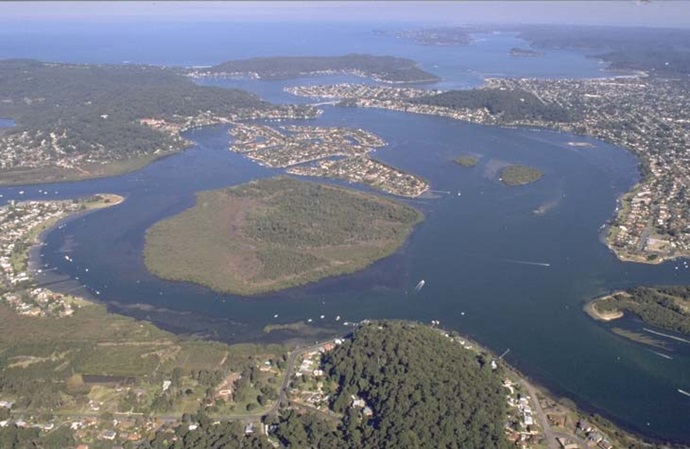
As part of our water quality monitoring program we assess the water quality and ecosystem health of an estuary using a range of relevant indicators. We sample 3 sites and a number of inflowing streams on a monthly basis over summer in Brisbane Water as part of a collaborative program with Central Coast Council.

The most recent sampling was completed over the 2020–21 summer. The results of the monitoring program, including a detailed water quality report card for Brisbane Water, are available on the the Central Coast Council website.

Brisbane Water water quality report card showing colour-coded ratings (red, orange, yellow, light green and dark green, which represent very poor, poor, fair, good and excellent, respectively) for algae and water clarity. Algae is rated 'good' and water clarity is rated 'excellent', giving an overall rating of 'excellent' or 'A'.

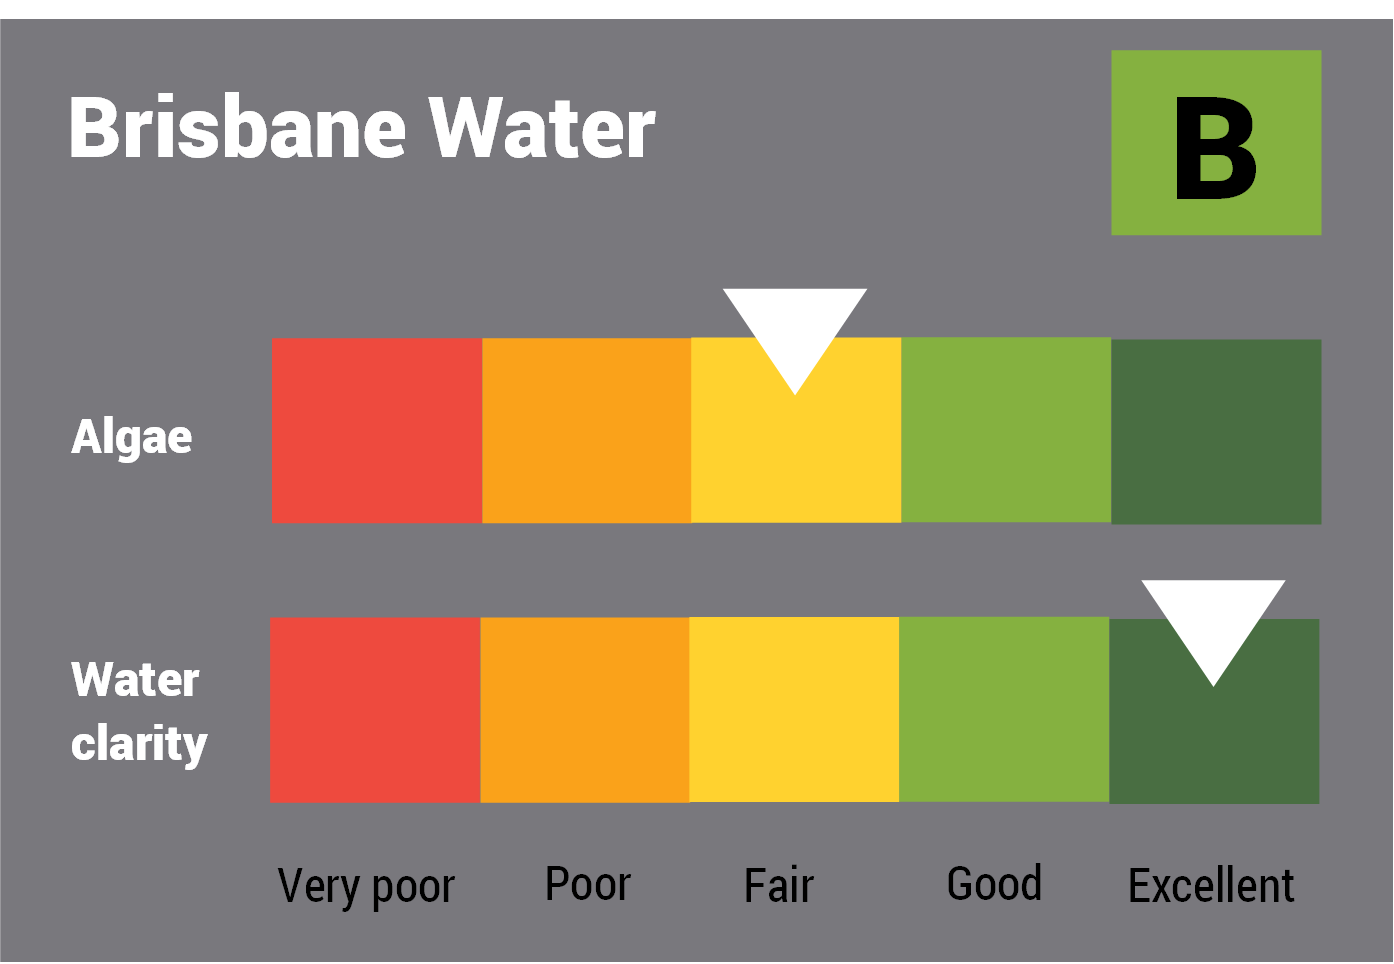
This report card represents 2 water quality indicators that we routinely measure: the amount of algae present and water clarity. Low levels of these 2 indicators equate with good water quality.

The report card shows the condition of the estuary was good with:

  • algae abundance graded fair (C)
  • water clarity graded excellent (A)
  • overall estuary health graded good (B).

Find out more about our estuary report cards and what each grade means. Read our sampling, data analysis and reporting protocols and find out how we calculate these grades.

We have monitored water quality in Brisbane Water since 2010. This table shows the water quality grades for this estuary over that time.

Brisbane Water historic water quality grades from 2010-11 for algae and water clarity. Colour-coded ratings (red, orange, yellow, light green and dark green represent very poor (E), poor (D), fair (C), good (B) and excellent (A), respectively).

Grades for algae, water clarity and overall are represented as:

  • A – excellent
  • B – good
  • C – fair
  • D – poor
  • E – very poor.

As part of our Beachwatch program we assess swimming suitability at 4 swimming sites in Brisbane Water using microbial indicators. Central Coast Council collect samples at each site weekly between October and April, and monthly from May to September, to calculate the suitability grade. Sampling is ongoing. Each grade reflects the most recent 100 water quality results to April 2022. Find out more about how we monitor beach water quality.

Local government area Swim site name Grade
Central Coast Yattalunga Baths Poor
Woy Woy Baths Poor
Davistown Baths Poor
Pretty Beach Baths Poor

Estuarine, lake and lagoon water can sometimes be unsuitable for swimming, especially after rainfall when stormwater and wastewater can overflow into swimming areas. Learn more about what the grades mean and how we grade swimming sites on our beach classification webpage.

Water sampling and laboratory analysis was funded by Central Coast Council.

Physical characteristics

Estuary type: Lake

Entrance
location
Latitude (ºS) –33.52
Longitude (ºE) 151.33
Catchment area (km2) 152.5
Estuary area (km2) 28.3
Estuary volume (ML) 84,198.7
Average depth (m) 3.1

Tidal exchange volume

Tidal exchange volume or tidal prism data is available for this estuary. This tidal prism was measured in 1989.

Tide state Flow
(106 m3)
Local tidal
range (m)
Sydney Harbour
tidal range (m)
Ebb flow 25.8 1.26 1.36
Flood flow 21.3 1.42
1.49
Notes: km2 = square kilometres; m = metres; m3 = cubic metres; ML = megalitres.

Water depth and survey data

Bathymetric and coastal topography data for this estuary are available in our data portal.

Land use

The catchment of Brisbane Water is highly disturbed. Urban development is the dominant land use and occupies about 40% of the catchment. Substantial forested areas are protected in conservation areas to the east and west of the estuary. The major towns of Gosford and Woy Woy are located on the shores of Brisbane Water.

National and marine parks

Community involvement

Local government management

Local councils manage estuaries within their area unless the estuary is attached to a marine park. Central Coast Council manage this estuary.

Information about this estuary can be found on the council’s Brisbane Water webpage.