Hawkesbury River

Our water quality monitoring program has shown the Hawkesbury River estuary to have fair water quality. Find out more about the estuary and its unique features.

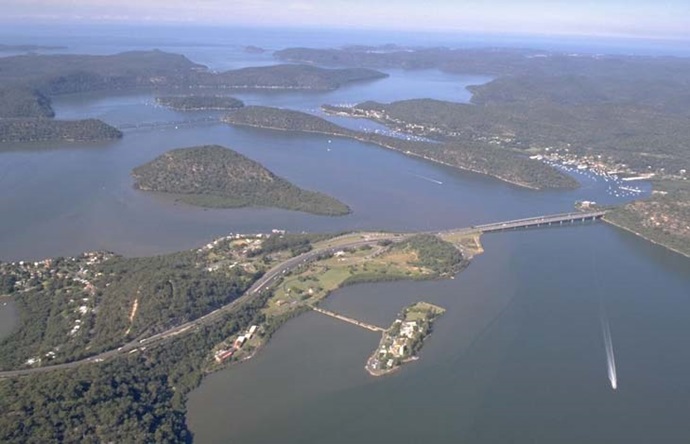
The Hawkesbury River estuary marks the northern boundary of the Greater Sydney Metropolitan region and the southern boundary of the Central Coast region of New South Wales. The estuary is a large drowned valley that drains the second largest coastal catchment in the state and enters the ocean via Broken Bay and Pittwater.

The significance of the Hawkesbury River cannot be understated. The catchment supports large agricultural and tourism industries to name just two. Many of its major tributaries are regulated and provide drinking water for millions of people. It hosts myriad recreational activities for residents of the local government areas it encompasses as well as visitors to the Greater Sydney region. It has a rich colonial history, and a significant traditional history.

The Hawkesbury–Nepean River and its tributaries are a defining feature of Greater Sydney. 

Estuary health and features

Water quality

As part of our water quality monitoring program we assess the water quality and ecosystem health of an estuary using a range of relevant indicators. We sample a subset of the estuaries located between Taree and Wollongong every 3 years. The most recent sampling in the Hawkesbury River was completed over the 2019–20 summer when 2 sites.

Hawkesbury River water quality report card showing colour-coded ratings (red, orange, yellow, light green and dark green, which represent very poor, poor, fair, good and excellent, respectively) for algae and water clarity. Algae is rated 'fair' and water clarity is rated 'good', giving an overall rating of 'Fair' or 'C'.

This report card represents 2 water quality indicators that we routinely measure: the amount of algae present and water clarity. Low levels of these 2 indicators equate with good water quality.

The report card shows the condition of the estuary was fair with:

  • algae abundance graded fair (C)
  • water clarity graded good (B)
  • overall estuary health graded fair (C).

We also sample a number of inflowing tributaries of the lower Hawkesbury River, including Mooney Mooney Creek, Patonga Creek and Mullet Creek as part of a collaborative program with Central Coast Council. The most recent sampling was completed over the 2019–2020 summer.

The results of the monitoring program, including a detailed water quality report card for the inflowing tributaries, are available on the Central Coast Council website.

Find out more about our estuary report cards and what each grade means. Read our sampling, data analysis and reporting protocols and find out how we calculate these grades.

We have monitored water quality in the Hawkesbury River since 2010. This table shows the water quality grades for this estuary over that time.

Hawkesbury River historic water quality grades from 2010-11 for algae and water clarity. Colour-coded ratings (red, orange, yellow, light green and dark green represent very poor (E), poor (D), fair (C), good (B) and excellent (A), respectively).

Grades for algae, water clarity and overall are represented as:

  • A – excellent
  • B – good
  • C – fair
  • D – poor
  • E – very poor.

Physical characteristics

Estuary type: Drowned river valley

Entrance
location
Latitude (ºS) –33.56
Longitude (ºE) 151.31
Catchment area (km2) 21,624.1
Estuary area (km2) 114.5
Estuary volume (ML) 1,541,412
Average depth (m) 13.8

Tidal exchange volume

Tidal exchange volume or tidal prism data is available for this estuary. This tidal prism was measured in 1993. 

Tide state Flow
(106 m3)
Local tidal
range (m)
Sydney Harbour
tidal range (m)
Ebb flow 191 1.6 1.53
Flood flow 199 1.66 1.63
Notes: km2 = square kilometres; m = metres; m3 = cubic metres; ML = megalitres.

Water depth and survey data

Bathymetric and coastal topography data for this estuary are available in our data portal.

Land use

Over 70% of the Hawkesbury River catchment remains as undisturbed forest, a lot of which is protected within conservation areas. Grazing areas account for around a quarter of land-use, with urban areas and mixed horticulture making up the remainder of the catchment.

Water use

Find out about water use in the Hawkesbury River, including information about major water users, real-time flow data, and environmental and water sharing plans.

National and marine parks

Community involvement

A host of landcare groups operate within the Hawkesbury catchment though which volunteers can get involved in environmental work. For example, Hornsby Shire Council coordinates a bushcare group.

Local government management

Local councils manage estuaries within their area unless the estuary is attached to a marine park. The Hawkesbury and Nepean Rivers flow through a number of local government areas.

Hornsby Shire Council manage the Hawkesbury estuary. Information about this estuary can be found on the council’s Hawkesbury estuary webpage.