Fire is a natural ecological process in the Australian landscape, with many vegetation communities adapted to fire.
Fire extent and severity mapping (FESM) uses satellite imagery and machine learning to deliver timely fire severity maps. These maps help us:
- classify and map fires
- understand relationships between fuels and fire behaviour
- interpret how a fire has changed the landscape
- support better land and fire management
- support on-ground actions and conservation planning.
Before fire extent and severity mapping was developed, vegetation loss due to fire was reported as part of our Statewide Landcover and Tree Study reporting until 2018.
In 2021, we started publishing annual reports on fire extent and severity at a landscape scale using fire extent and severity mapping.
Annual report
Each fire extent and severity mapping annual report summarises the fire season for that year and is accompanied by data analyses for the reported fire season and comparisons with previous fire seasons.
Data is available through the Sharing and Enabling Environment Data portal.
When maps are produced
We produce summary maps annually after each fire season to investigate changes in vegetation trends over time. This enables our scientists to better understand how future fire events may unfold and the potential impacts of these events on the environment.
The fire extent and severity mapping statewide map and datasets are available on the Sharing and Enabling Environmental Data (SEED) portal or by searching 'FESM SEED'.
Mapping method
Since 2018, we have researched and developed a rigorous remote sensing approach to mapping fire extent and severity.
An early operational system was deployed in December 2019 to provide rapid-response severity mapping to support the department's operations during the emerging black summer bushfire crisis.
The refined operational system was launched in July 2020 and:
- links with the Rural Fire Service IT infrastructure
- automates the processing of fires
- delivers mapping in near-real time.
Our scientists are leading the continued refinement and further development of fire extent and severity mapping. The program will benefit from ongoing field validation and additional training data.
The Supporting fire management with the fire extent and severity maps fact sheet contains more information about the fire mapping methodology.
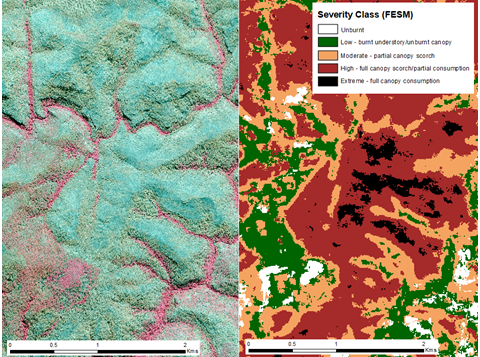
Fire severity classes
The fire extent and severity mapping system uses standardised fire severity classes to compare different fires across the landscape.
The severity classes represent ecologically meaningful definitions based on levels of canopy scorch and consumption (see Table).
This helps land managers and researchers understand how fires have affected the landscape and informs:
- on-ground conservation
- fire management actions
- recovery efforts.
| Pixel value | Severity class | Description | Photo interpretation cues (false colour infrared) | Percentage foliage fire affected |
|---|---|---|---|---|
| 0 | Unburnt | Unburnt surface with unburnt canopy | Dark red (live understorey) between the dark red tree crowns | 0% canopy and understorey burnt |
| 1 | Extent only | Burnt surface (grass fires) | Mostly black and dark grey | 100% burnt area |
| 2 | Low | Burnt understory with unburnt canopy | Dark grey (burnt understorey) between the dark red tree crowns | >10% burnt understorey >90% green canopy |
| 3 | Moderate | Partial canopy scorch | A mixture of green, orange and brown colours in tree canopies | 20-90% canopy scorch |
| 4 | High | Complete canopy scorch (+/– partial canopy consumption) | No green or orange, but an even brown colour in tree canopies | >90% canopy scorched <50% canopy biomass consumed |
| 5 | Extreme | Complete canopy consumption | Mostly black and dark grey, largely no canopy cover | >50% canopy biomass consumed |
Table note: Fire severity classification ruleset based on high-resolution aerial photo interpretation, adapted from McCarthy et al. (2017) and Collins et al. (2018).
NSW Post-fire Biomass Recovery Monitoring for 3 years following 2019–20
Our scientists have developed a novel approach for broad-scale, early monitoring of post-fire biomass recovery.
Observational monitoring of post-fire biomass recovery is important to help us understand drivers of recovery processes, identify vulnerable ecosystems and prioritise management to support ecological resilience.
Following the extreme bushfire season of 2019–20, there is concern regarding the pressure on ecological resilience particularly due to short inter-fire intervals. The report summarises the method and analysis of post-fire recovery trajectories across the 2019–20 fire ground.
Overall, there has been a widespread and vigorous post-fire biomass response. This is typical in the resprouter dominated forests across much of New South Wales. However, the data also highlight areas of limited or delayed post-fire recovery.
The intended use of the data is for early monitoring of post-fire recovery of vegetation cover at the landscape scale to help identify potentially vulnerable ecosystems. The mapping must not be interpreted as a surrogate estimate for all levels of post-fire ecological recovery. There may be additional areas of concern not highlighted by this method.
Data is available through the Sharing and Enabling Environment Data portal.