
National standards for PM10
- Annual average – 25 micrograms per cubic metre of air (25 µg/m3)
- Daily average – 50 micrograms per cubic metre of air (50 µg/m3)
Annual average PM10 levels
During 2020, annual average PM10 levels remained below the national standard at all 41 monitoring stations in NSW metropolitan and regional centres, where annual average data were available, except for Stockton at the Port of Newcastle (refer to the figure below: Summary of PM10 observations in NSW in 2020).
Annual average PM10 levels ranged from 11.9 µg/m3 at Coffs Harbour on the Mid North Coast to 34.5 µg/m3 at Stockton.
In 2020, there was a fall in annual average PM10 concentrations at all stations and in the number of stations exceeding the annual average standard, compared with 2019. In 2019, the annual average PM10 levels ranged from 19.5 µg/m3 at Albion Park South in the Illawarra region to 43.6 µg/m3 at Stockton, with 17 sites exceeding the annual average PM10 standard.
PM10 particle levels were far lower throughout the state in 2020 compared to the previous two years, as drought conditions weakened and bushfire impacts moderated following significant rainfall events from February 2020.
Historically, annual average PM10 levels generally are higher in the Upper Hunter and the Port of Newcastle (due to local industrial activities) than elsewhere in the State. Wagga Wagga North, in the South-west Slopes, is another station which typically records higher PM10 annual averages, particularly during drought conditions due to windblown dust. More information about particle levels in the Hunter regions can be found in Focus areas – on the Hunter Valley and Stockton tabs.
Daily average PM10 levels
Daily PM10 levels exceeded the national standard at one or more of the 41 stations in metropolitan or regional population centres on 87 days in 2020. Excluding Stockton, where sea salt is a major contributor to PM10 levels, there were 55 days in 2020 with daily PM10 levels exceeding the standard (compared with 148 days in 2019, including new stations).
All air quality monitoring stations in metropolitan and regional population centres recorded days with PM10 levels exceeding the national standard in 2020, except Penrith and Morisset (where PM10 data came online on 1 July 2020 and 26 November 2020, respectively).
Around half the days with daily PM10 levels exceeding the standard (46 days, 53%) occurred in January and February, associated with the intense drought conditions across NSW and the more frequent widespread dust storms and extensive smoke that accompanied the extreme 2019–20 bushfire season.
In 2020 all stations, except Armidale and Gunnedah, recorded their highest daily average PM10 levels in January. At Armidale and Gunnedah, the highest daily average PM10 levels occurred on 20 August 2020, due to a widespread dust storm.
The maximum daily PM10 level recorded across stations in metropolitan and regional population centres was 556.7 µg/m3, at Goulburn in the Southern Tablelands on 1 January 2020, due to bushfire smoke. On the previous day, Goulburn recorded 494.1 µg/m3, the maximum daily PM10 average for the State in 2019, due to a combination of bushfire smoke and a widespread dust storm.
Merriwa, a background air quality monitoring station in the Upper Hunter region, recorded the highest maximum daily PM10 level across the network in 2020, with 620.7 µg/m3 on 11 January 2020, during a widespread dust storm. This was the fourth highest PM10 pollution day since 1994 and the highest since 2009.
In the Hunter Valley, sea salt spray results in elevated PM10 levels at Stockton. Local industrial sources also affect particle levels throughout the Hunter Valley. More information on the special purpose of industry-funded Hunter Valley monitoring networks is found in the Hunter Valley and Stockton tabs on the focus areas webpage.
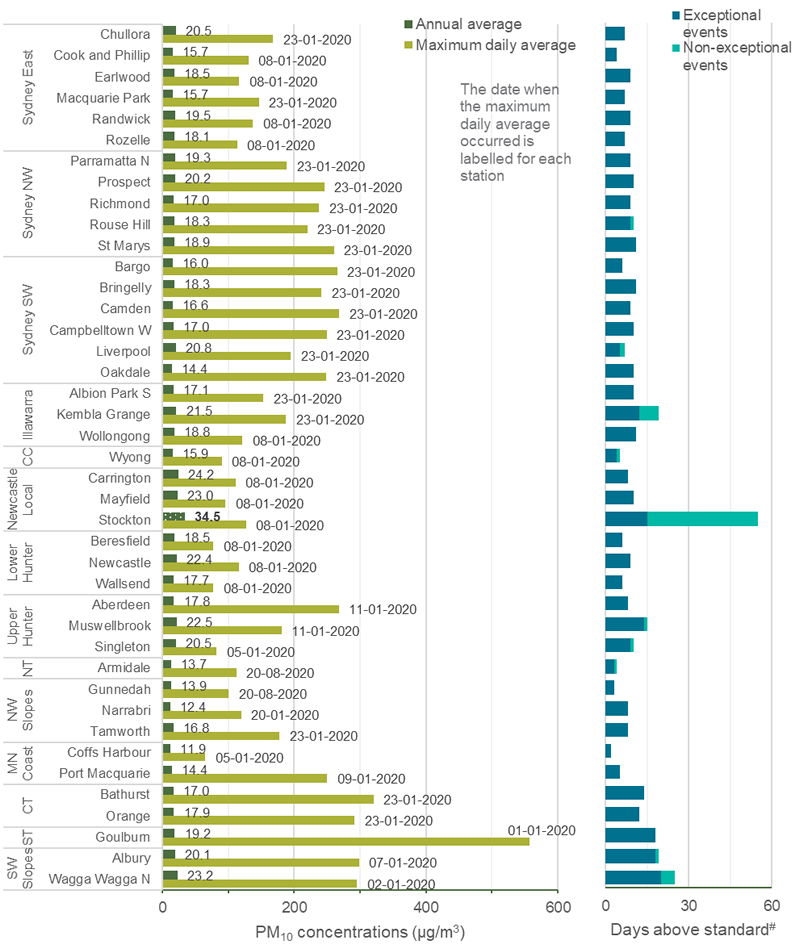
Note: SW = South West, NW = North West, CC = Central Coast, CT = Central Tablelands, NT = Northern Tablelands, ST = Southern Tablelands, MN Coast = Mid-north Coast.
Dotted shading and bold shows levels exceeding the annual average of 25 µg/m3.
# Days exceeding standard are divided into exceptional and non-exceptional events. Exceptional events are those related to bushfires, hazard reduction burns and continental-scale dust storms. These are not counted towards the NEPM goal of ‘no days above [i.e. exceeding] the particle standards in a year’.
New stations at Penrith and Morisset, coming online on 1 July 2020 and 26 November 2020, respectively. are not included in this graph. There were no days exceeding the daily PM10 standard at these stations since commissioning.