
National standards for PM2.5
- Annual average – 8 micrograms per cubic metre of air (8 µg/m3)
- Daily average – 25 micrograms per cubic metre of air (25 µg/m3)
Annual average PM2.5 levels
During 2020, annual average PM2.5 levels exceeded the national standard at 14 of the 39 stations in metropolitan and regional population centres, where annual average PM2.5 data were available. (An annual average is not reported for the Newcastle station as less than 75% of the data were available, due to an instrument fault.) (Refer to the figure below: Summary of PM2.5 observations in NSW in 2020).
PM2.5 annual average levels exceeded the standard at the following metropolitan and regional population centres:
- Chullora in Sydney East
- Parramatta North, Prospect and Richmond in Sydney North-west
- Bringelly and Liverpool in Sydney South-west
- Stockton in the Port of Newcastle
- Singleton and Muswellbrook in the Upper Hunter
- Armidale in the Northern Tablelands
- Orange in the Central Tablelands
- Goulburn in the Southern Tablelands
- Albury and Wagga Wagga North in the South-west Slopes
The Bradfield Highway roadside monitoring station (north of the Sydney Harbour Bridge, adjacent to one of the State’s busiest roads) also recorded an annual average PM2.5 level exceeded the national standard.
Annual average PM2.5 levels ranged from 5.3 µg/m3 at Coffs Harbour on the Mid-North Coast to 11.8 µg/m3 at Goulburn in the Southern Tablelands during 2020.
There was a fall in annual average PM2.5 concentrations and the number of stations exceeding the annual average standard in 2020, compared with 2019. In 2019, annual average PM2.5 levels ranged from 7.8 µg/m3 at Narrabri in the North-west Slopes region to 17.2 µg/m3 at Armidale in the Northern Tablelands, with 35 of 36 sites exceeding the annual average PM2.5 standard. Particle levels were far lower compared to the previous two years, as the extreme bushfire season ended and drought conditions weakened throughout most of NSW following significant rainfall events from February 2020.
Daily average PM2.5 levels
Daily PM2.5 levels were over the standard on 59 days in 2020 at one or more of the 42 monitoring stations in metropolitan or regional population centres (compared with 137 days in 2019, including new stations).
All stations in metropolitan and regional population centres, plus Camberwell, recorded daily PM2.5 levels exceeding the national standard on one or more days in 2020 (except Penrith and Morisset where PM2.5 data came online on 1 July 2020 and 26 November 2020, respectively).
Around half the days with daily PM2.5 levels over the standard (28 days, 47%) occurred in January and February, during intense drought conditions, extensive bushfires and frequent widespread dust storms. Armidale, alone, recorded a further 32% of days (19 days) with PM2.5 levels over the standard from May to August, due to smoke from domestic wood heaters. Hazard reduction burns in the Central Tablelands in April and May and around Sydney from August to October also contributed to particle levels in 2020.
The most days exceeding the PM2.5 daily standard were recorded at:
- Armidale (27 days) – due to wood smoke from domestic heaters on cold calm nights with temperatures close to or below zero degrees (23 days), bushfire smoke (3 days) and a combination of bushfire smoke and dust (1 day)
- Albury (16 days) – due to bushfire smoke (15 days) and a combination of bushfire smoke and dust (1 day)
- Goulburn (16 days) – due to bushfire smoke (13 days), a combination of bushfire smoke and dust (2 days) and a widespread dust storm (1 day)
- Orange (15 days) – due to bushfire smoke (8 days), wood smoke (3 days), hazard reduction burning (2 days), a combination of bushfire smoke and dust (1 day) and a widespread dust storm (1 day).
- Bargo (14 days) – due to bushfire smoke (10 days), a combination of bushfire smoke and dust (3 days) and hazard reduction burning (1 day).
The maximum daily average PM2.5 level was 559.5 µg/m3, recorded at Wagga Wagga North in the South-west Slopes on 5 January 2020, due to bushfire smoke during the extreme 2019–20 bushfire season. This was the highest daily PM2.5 level on NSW records since 1994. For all stations, except Camberwell and Gunnedah, the highest recorded daily average PM2.5 during 2020 occurred between 1 and 9 January, during the most severe bushfire smoke period.
In 2020, although there were fewer days exceeding the PM2.5 daily standard compared with 2019, the maximum daily PM2.5 particle level was higher, as extensive fires developed in the south of the State in January. In 2019, the maximum daily PM2.5 concentration was 442.7 µg/m3, recorded at the Port Macquarie bushfire emergency monitoring station on 15 November 2019 (during the bushfire emergency period).
PM2.5 particle levels were far lower throughout the State in 2020 compared to the previous two years, as drought conditions weakened and bushfire impacts moderated following significant rainfall events from February 2020.
Wood smoke from domestic wood heaters causes elevated PM2.5 particle levels, notably on weekends across the State, except for Armidale where elevated levels are seen throughout the week in the cooler months. Under the current NSW regulatory regime, wood smoke is managed largely by local government. Local councils have regulatory powers to control installation of wood heaters using their planning instruments. The NSW Environment Protection Authority (EPA) collaborates with councils and other stakeholders to raise public awareness about wood smoke impacts and help wood heater owners to reduce particle pollution from their wood heaters.
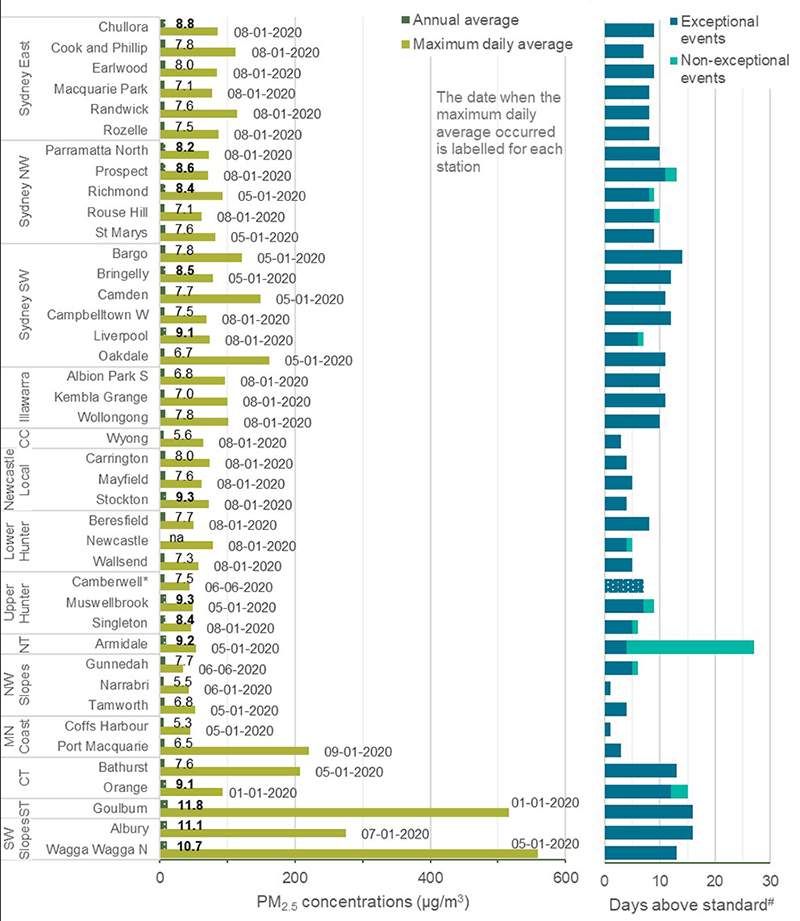
Note: SW = South West, NW = North West, CC = Central Coast, CT = Central Tablelands, NT = Northern Tablelands, ST = Southern Tablelands, MN Coast = Mid-north Coast.
Dotted shading and bold shows levels exceeding the annual average of 8 µg/m3.
na Annual average not reported (<75% of data available – PM2.5 data not available at Newcastle from 11 March to 4 June 2020 due to an instrument fault)
# Days exceeding standard are divided into exceptional and non-exceptional events. Exceptional events are those related to bushfires, hazard reduction burns and continental-scale dust storms. These are not counted towards the NEPM goal of ‘no days above [i.e. exceeding] the particle standards in a year’.
*Camberwell is an Upper Hunter Air Quality Monitoring Network small community monitoring station which is not suitable for assessing performance against NEPM standards, and therefore, events are not reported as exceptional or non-exceptional (see the Hunter Valley tab of the Focus areas webpage).
New stations at Penrith and Morisset, coming online on 1 July 2020 and 26 November 2020, respectively. are not included in this graph. There were no days exceeding the daily PM10 standard at these stations since commissioning.