
NSW annual air quality statement 2021: Event days
Air quality in New South Wales met national standards between 93% and 100% of the time across regions in 2021, an improvement compared with 2020. There were fewer events days in 2021 reaching pollution levels at twice the national standard, with 9 days compared with 24 days in 2020.
- In 2021, air quality levels remained within national standards 100% of the time in several regions, including the Central Coast, Lake Macquarie, Mid North Coast and North West Slopes, where no days were seen above the national standards. At other metropolitan and regional population centres that saw days above the national standards, such as the Newcastle Local region, air quality remained within national standards for most of the year (93%) (Refer to Figure: Percentage of days below and above standards in New South Wales).
- The network recorded 53 days in 2021 with one or more criteria pollutant levels over national standards at one or more metropolitan or regional population centres (compared with 118 days in 2020). (Refer to Table: Number of days above national standards in 2021 and Figure: NSW Particulate and ozone exceedances in 2021 for a regional breakdown).
Excluding Stockton, where sea salt is a major contributor to PM10 levels, there were 33 days in 2021 with pollution levels over national standards (compared with 87 days in 2020). - The days over national standards in 2021 were mostly due to elevated PM10 and PM2.5 levels. This was followed by five ozone pollution days and one day with a single 1-hour average sulfur dioxide (SO2) level over the national standard, recorded at Muswellbrook in the Upper Hunter on 4 February 2021. Levels for nitrogen dioxide (NO2) and carbon monoxide (CO) remained below national standards in 2021.
- In the industry-funded Newcastle Local network, Stockton is often affected by sea salt spray due to its proximity to the coast, particularly in the warmer months (Refer to Figure: Contributors to PM10 exceedances in 2021). Local industrial sources also affect particulate levels in the Hunter Valley. More information on the special purpose of industry-funded Hunter Valley monitoring networks is found in the Hunter Valley and Stockton tabs on the Focus areas webpage.
- Exceedances of air quality standards for particles and ozone are deemed to be caused by exceptional events where data are adversely affected by bushfires, jurisdiction authorised hazard reduction burning or continental scale windblown dust (Refer to Figure: NSW particulate and ozone exceedances in 2021).
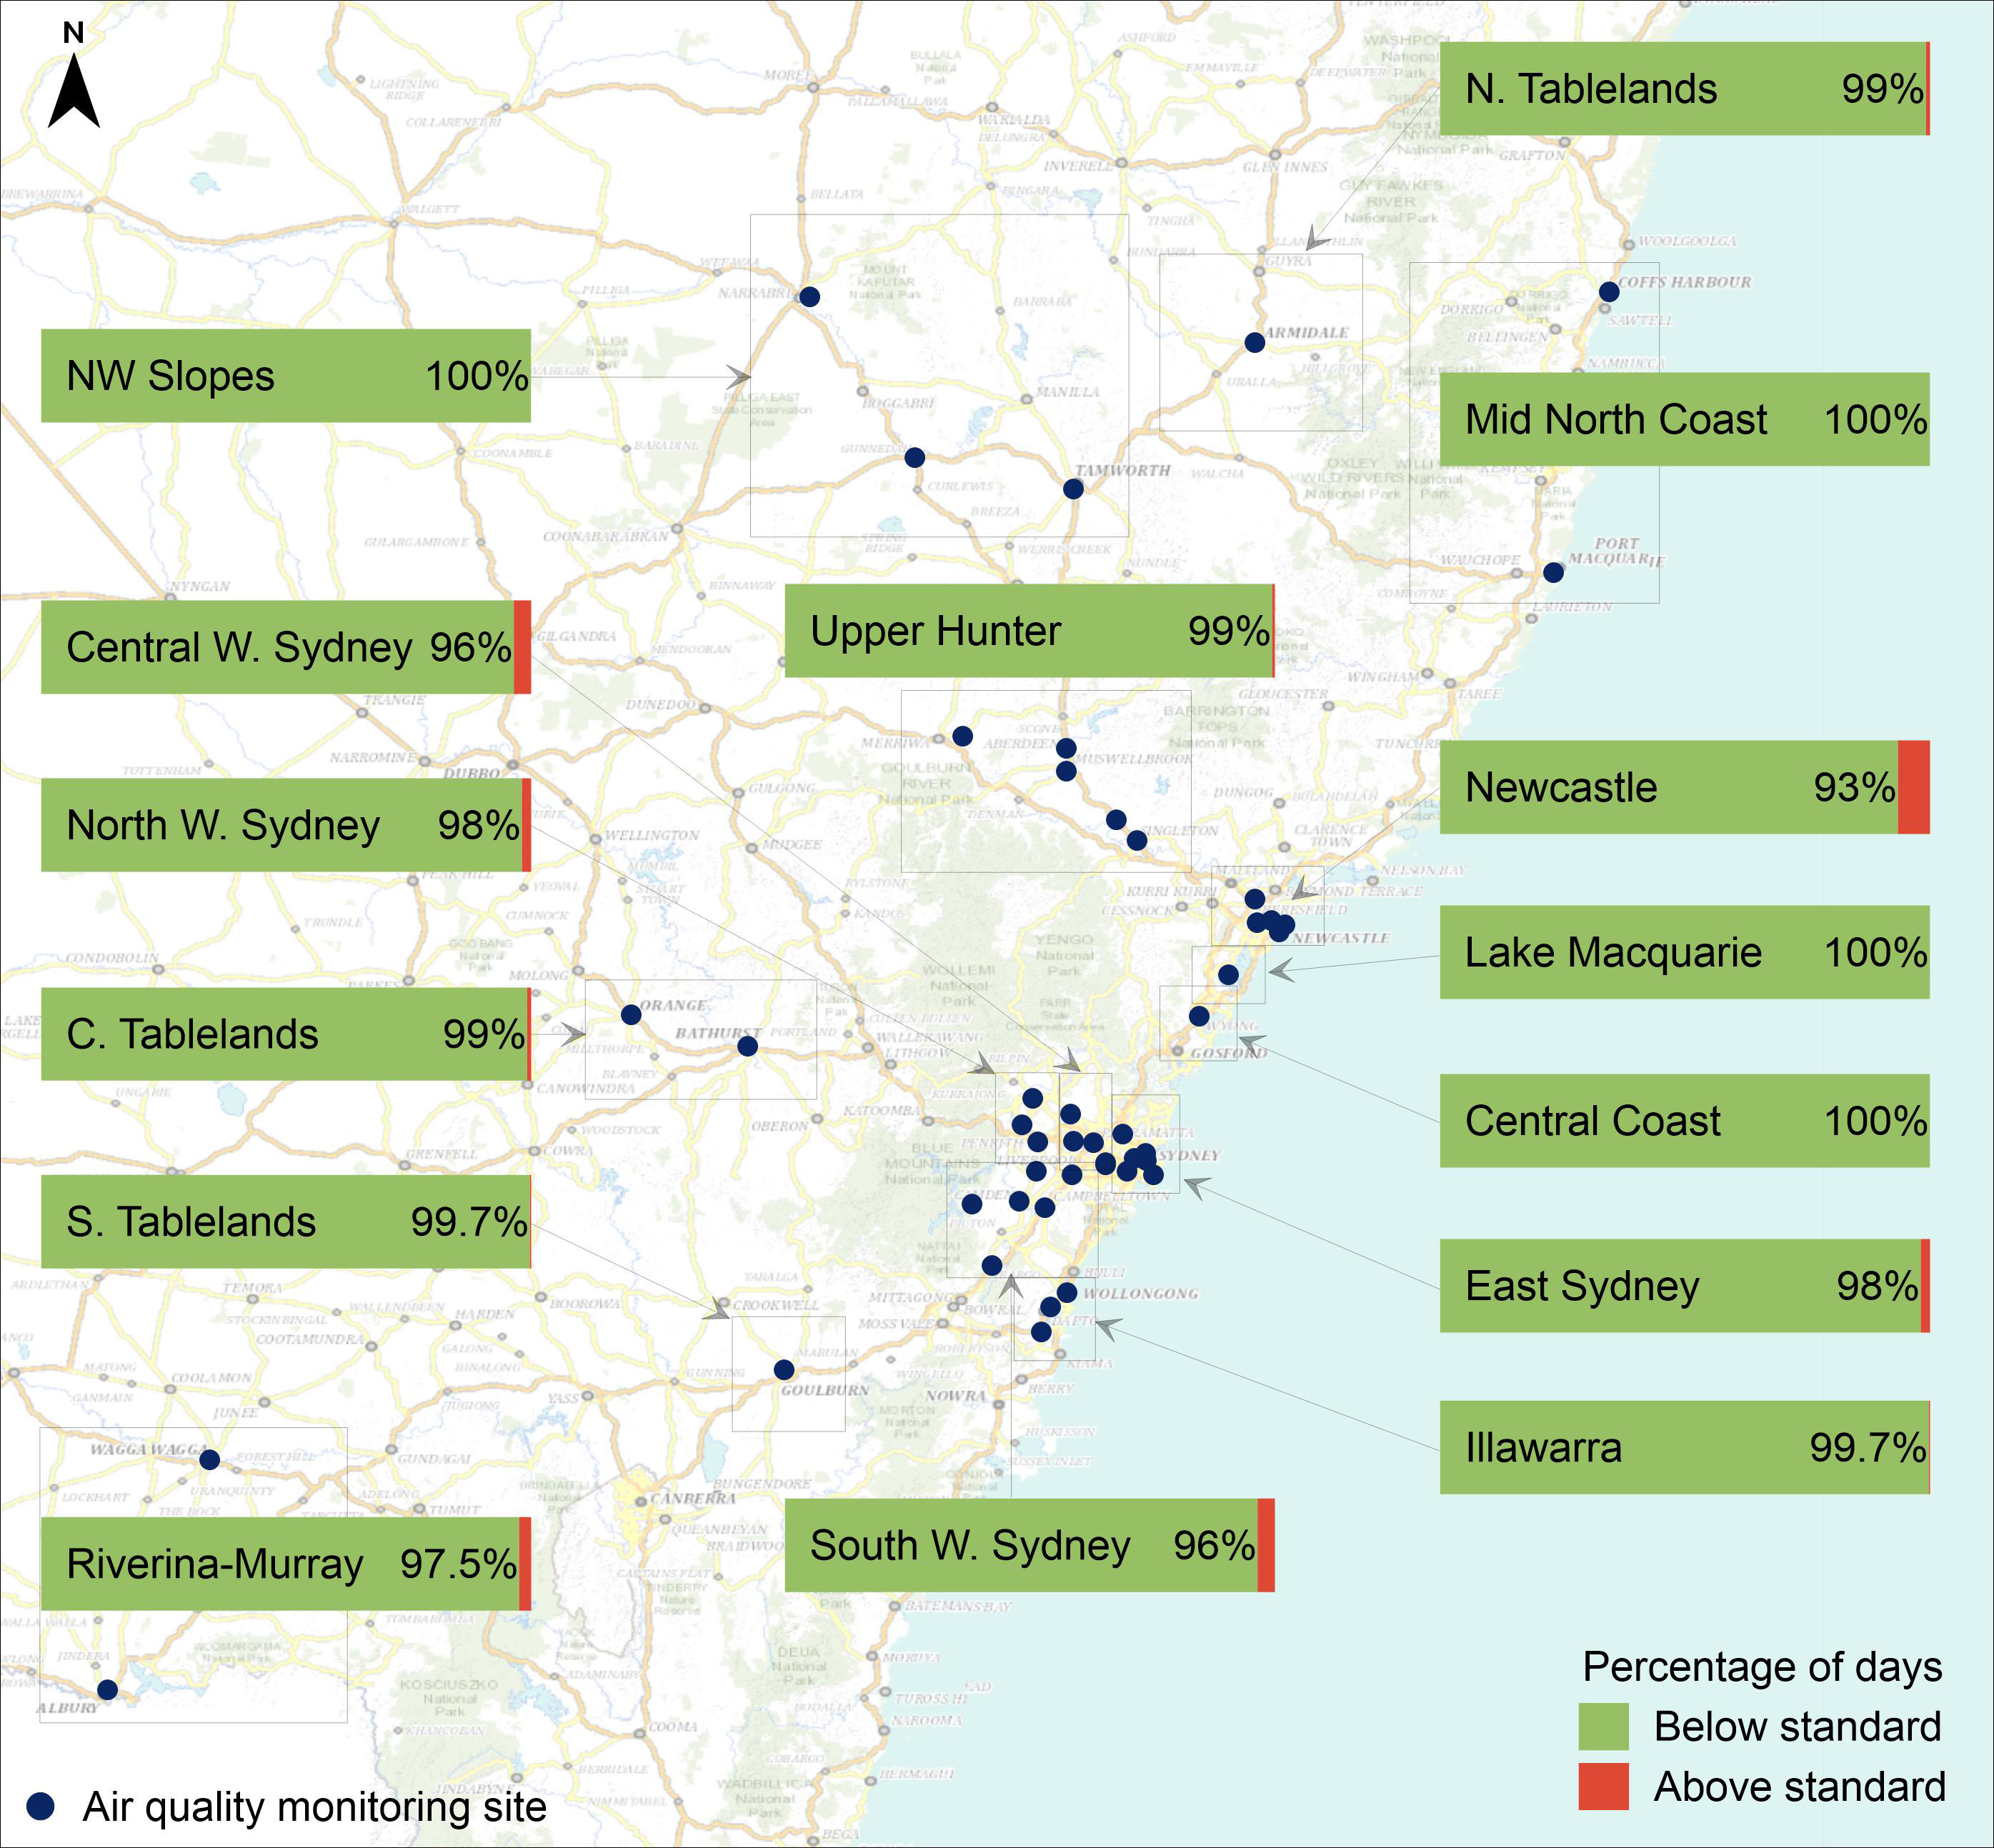
Percentage of days below and above standards in NSW. The percentage of days air quality in different regions were below air quality standards (shown in green). The percentage of days in each region that air quality was above the standard are shown in red.
Number of days above national standards in 2021, compared with 2020
| Pollutant | 2021 | 2020 | ||
|---|---|---|---|---|
| Number of days over standard | Percentage of time standards were met | Number of days over standard | Percentage of time standards were met | |
| PM10 | 40 | 89% | 87 | 76% |
| PM10 (excluding Stockton) | 18 | 95% | 55 | 85% |
| PM2.5 | 23 | 94% | 59 | 84% |
| Ozone * | 5 (3) | 98.6% (99.2%) | 9 (6) | 97.5% (98.4%) |
| SO2 * | 1 (0) | 99.7% (100%) | 2 (0) | 99.5% (100%) |
| NO2 * | 0 (0) | 100% (100%) | 2 (0) | 99.5% (100%) |
| CO | 0 | 100% | 0 | 100% |
* New (and old) standards – the National Environment Protection (Ambient Air Quality) Measure (NEPM) standards for Ozone, SO2 and NO2 were updated in 2021. Air quality data measured in 2020 and 2021 have been compared to both new and old standards, with the old standards presented in brackets. No changes were made to the PM10, PM2.5 or CO standard values.
Note: On any one given day, levels may have been over the standard for multiple pollutants, and at one or more air quality monitoring stations.
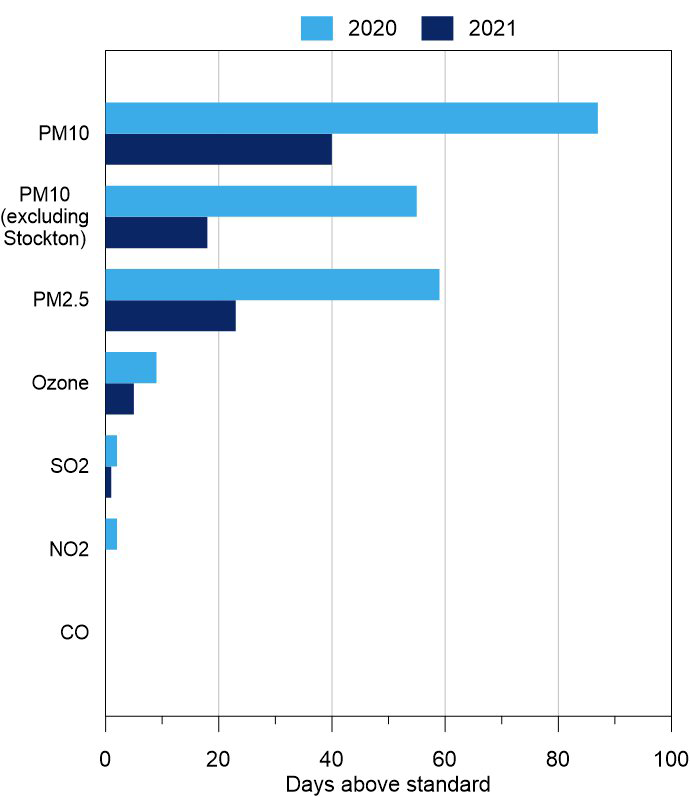
The number of days above the standard for all pollutants in 2021 compared to 2020. The pollutants include PM10, PM10 excluding data from Stockton, PM2.5, ozone, sulfur dioxide, nitrogen dioxide and carbon monoxide.
Note: The new NEPM standards have been applied for both 2021 and 2020 data.
Exceedances of air quality standards for particles and ozone are deemed to be caused by exceptional events where affected by bushfires, jurisdiction authorised hazard reduction burning or continental scale windblown dust (Refer to Figure: NSW particulate and ozone exceedances in 2021).
The figure below (Contributors to PM10, PM2.5 and ozone exceedances in 2021) presents the attributed causes of the exceedances of PM10 and PM2.5 levels. Days exceeding the daily PM10 standard in 2021 were significantly impacted by sea salt in the Newcastle region (at Stockton), and PM2.5 exceedances were primarily impacted by hazard reduction burns in the Sydney region. There was one instance of an exceptional ozone event day in 2021, caused by hazard reduction burns in the East Sydney region.
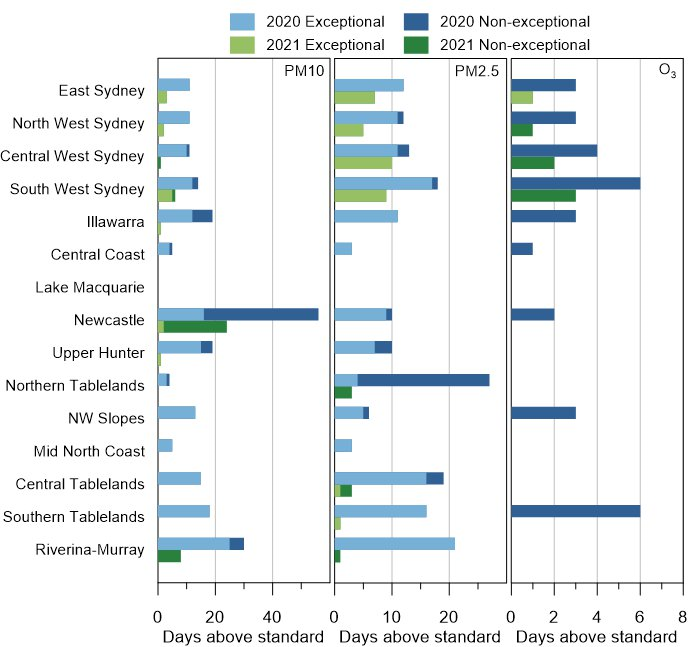
NSW particulate and ozone exceedances in 2021. Panel plot showing exception and non-exceptional event days in air quality regions in New South Wales for PM10, PM2.5 and ozone (O3) in both 2020 and 2021.
Note: Days exceeding standards are divided into exceptional and non-exceptional events. Exceptional events are those related to bushfires, hazard reduction burns and continental-scale dust storms The new NEPM ozone standards have been applied for 2020, however, 2020 data have not been classified as exceptional (all days are presented as non-exceptional). Given the impact of bushfires during January and February 2020, it is very likely that these would have been classified as exceptional events.
Ozone data collection began in the second half of 2020 in the Upper Hunter, Riverina-Murray, Lake Macquarie and Central Tablelands, and are not collected in the Northern Tablelands.
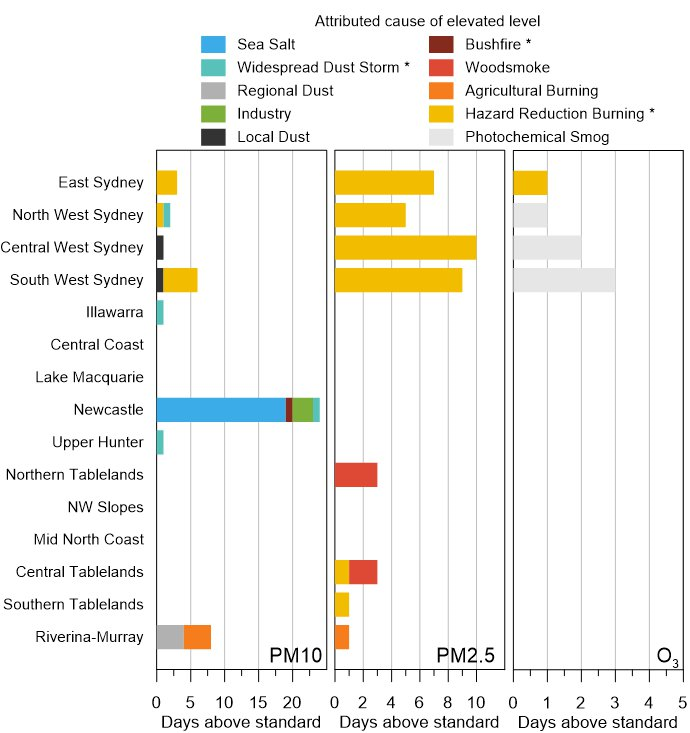
Contributors to PM10, PM2.5 and ozone exceedances in 2021. Panel plot showing the cause for exceedances of the PM10, PM2.5 and ozone (O3) standards across New South Wales for 2021.
* Exceptional events
Days with extremely poor air pollution levels are defined as those with pollution at levels exceeding twice the national standards for any pollutant.
In 2021, days with extremely poor air pollution occurred as a result of elevated particle levels, with daily PM10 levels exceeding 100 µg/m3 or daily PM2.5 levels exceeding 50 µg/m3. Levels for ozone, sulfur dioxide, nitrogen dioxide and carbon monoxide remained less than two times their relevant national standards. (Refer to Table: Number of days with extremely poor air quality in 2021).
There were 2 days in 2021 with extremely poor PM10 levels at monitoring stations in metropolitan and regional centres, compared with 20 in 2020. For PM2.5, there were 9 days with extremely poor levels in 2021 compared with 19 in 2020.
Number of days with extremely poor air pollution in 2021 (compared with 2020)
| Pollutant | 2021 | 2020 |
|---|---|---|
| Days with extremely poor air pollution | Days with extremely poor air pollution | |
| PM10 | 2 | 20 |
| PM10 (excluding Stockton) | 2 | 20 |
| PM2.5 | 9 | 19 |
| Ozone | 0 | 0 |
| SO2 | 0 | 0 |
| NO2 | 0 | 0 |
| CO | 0 | 0 |
There were more days with extremely poor PM2.5 levels than PM10 in 2021, which indicates that particulates on these days primarily comprised of finer particles (i.e. PM2.5), which is typical of smoke from landscape fires or other combustion sources. This is highlighted in the figure below (Contributors to PM10, PM2.5 and ozone exceedances in 2021) which shows the majority of PM2.5 days above the standard occurred during hazard reduction burns in Sydney.