National standards for PM2.5
- Annual average – 8 micrograms per cubic metre of air (8 µg/m3)
- Daily average – 25 micrograms per cubic metre of air (25 µg/m3).

Daily average PM2.5 levels met the national standard in metropolitan areas including Sydney Newcastle and the Illawarra, and regional centres on 94% of days in 2021, compared with 84% of days in 2020.
One of the 45 monitoring sites in New South Wales recorded an annual average PM2.5 level over the national standard in 2021, compared with 14 sites in 2020. This occurred at Stockton in Newcastle, which recorded an annual average PM2.5 level of 8.3 µg/m3 (compared to 9.3 µg/m3 in 2020).
Annual average PM2.5 levels in New South Wales in 2021 ranged from 3.1 µg/m3 at Narrabri in the North West Slopes to 8.3 µg/m3 at Stockton in Newcastle. This compares with 5.3 µg/m3 recorded at Coffs Harbour on the Mid North Coast and 11.8 µg/m3 recorded at Goulburn in the Southern Tablelands, for the lowest and highest annual averages respectively in 2020. Annual averages of particles as PM2.5 at most locations were the lowest levels seen in the past 9 years.
The Bradfield Highway roadside monitoring station (north of the Sydney Harbour Bridge, adjacent to one of the State's busiest roads) recorded an annual average PM2.5 level of 6.7 µg/m3 which was below the national standard.
In Newcastle, sea salt spray results in elevated particulate levels at Stockton. Local industrial sources also affect particulate levels throughout the Hunter Valley. More information about particle levels in the Hunter regions can be found in Focus areas – on the Hunter Valley and Stockton tabs.
Daily average PM2.5 levels exceeded the national standard at one or more of the 45 stations in metropolitan or regional population centres on 23 days in 2021, compared with 59 days in 2020.
In 2021, 23 of the 45 monitoring stations recorded daily average PM2.5 levels over the national standard. Of these, 19 sites are in Sydney, and one each is located in the Central Tablelands, Southern Tablelands, Northern Tablelands and Riverina-Murray regions. The majority of these stations, particularly in Sydney, were impacted by smoke from hazard reduction burns, whilst the Northern and Central Tablelands experienced days which were impacted by smoke from domestic wood heaters. One day in the Riverina-Murray was impacted by agricultural burning, however, it should be noted that the PM2.5 instrument at Wagga Wagga North was offline during a significant event in late April. Inferred concentrations from non-standard compliant instruments indicate there would have been about four additional PM2.5 exceedances due to agricultural burning during this time.
By comparison, in 2020, all monitoring sites recorded levels over the standard, except for stations which came online part-way through the year and were not online during the bushfire period in early 2020 (Lidcombe, Morisset, Penrith and Merriwa).
The maximum daily average PM2.5 level in 2021 was 213.1 µg/m3 recorded at Macquarie Park in East Sydney on 9 October 2021. These levels were significantly impacted by smoke from hazard reduction burns that took place nearby (less than 100m from the monitoring location). The day with the largest number of exceedances was 4 May, where 11 stations in Sydney recorded exceedances due to planned hazard reduction burning.
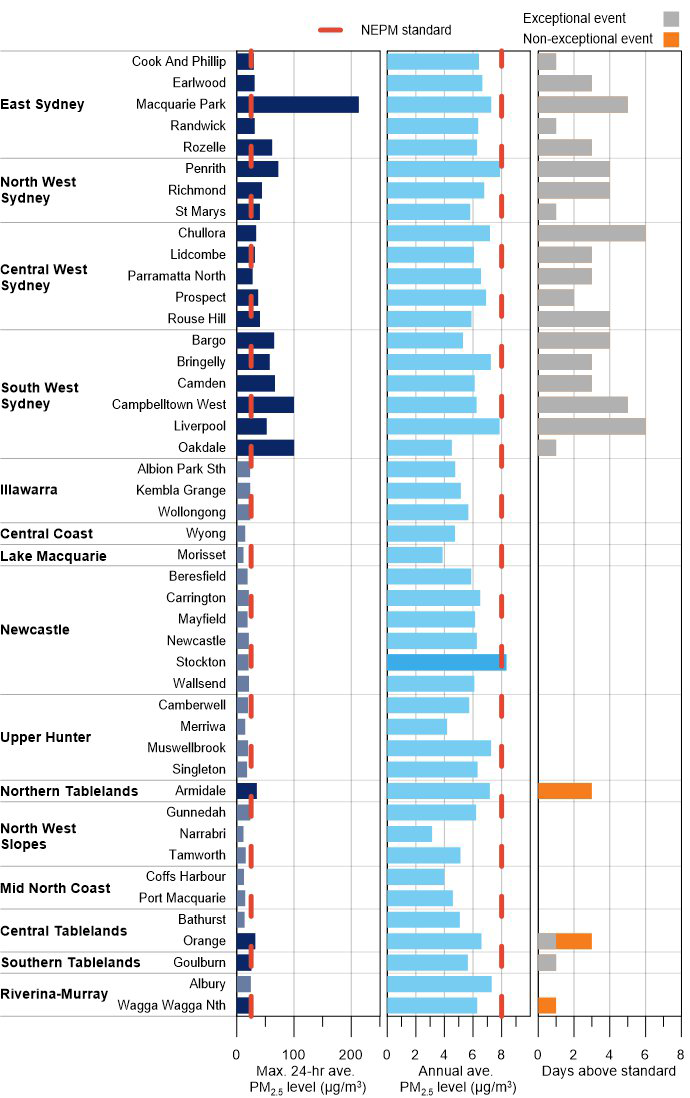
Bar chart summary of PM2.5 measurements at the 45 stations in metropolitan or regional population centres. It shows for PM2.5, the maximum daily average, annual average and exceptional and non-exceptional event days. Exceedances of the 24-hour and yearly standards are shaded darker.
Note: Days exceeding standard are divided into exceptional and non-exceptional events. Exceptional events are those related to bushfires, hazard reduction burns and continental-scale dust storms. These are not counted towards the National Environment Protection Measures (NEPM) goal of 'no days above (i.e. exceeding) the particle standards in a year'.