Vegetation clearing on Category 2 regulated land can be reported according to the authorising Act approvals (the Local Land Services Act or other relevant legislation, including the former Native Vegetation Act 2003), or as clearing that remains unallocated.
Unallocated clearing is vegetation clearing for which the Department of Climate Change, Energy, the Environment and Water has not been able to identify a formal authorisation or is unable to presume authorised using visual cues in the imagery.
The method to analyse authorised and unallocated clearing involves comparing detected areas of vegetation clearing against all available spatial data for approvals. Visual cues in the imagery may also be used, to presume authorisation as allowable activities under the Local Land Services Act (for example, clearing for fence lines or dams) or other Acts (for example, urban expansion). No analysis of the characteristics of these activities has been undertaken to ensure they comply with specifications under the relevant Act.
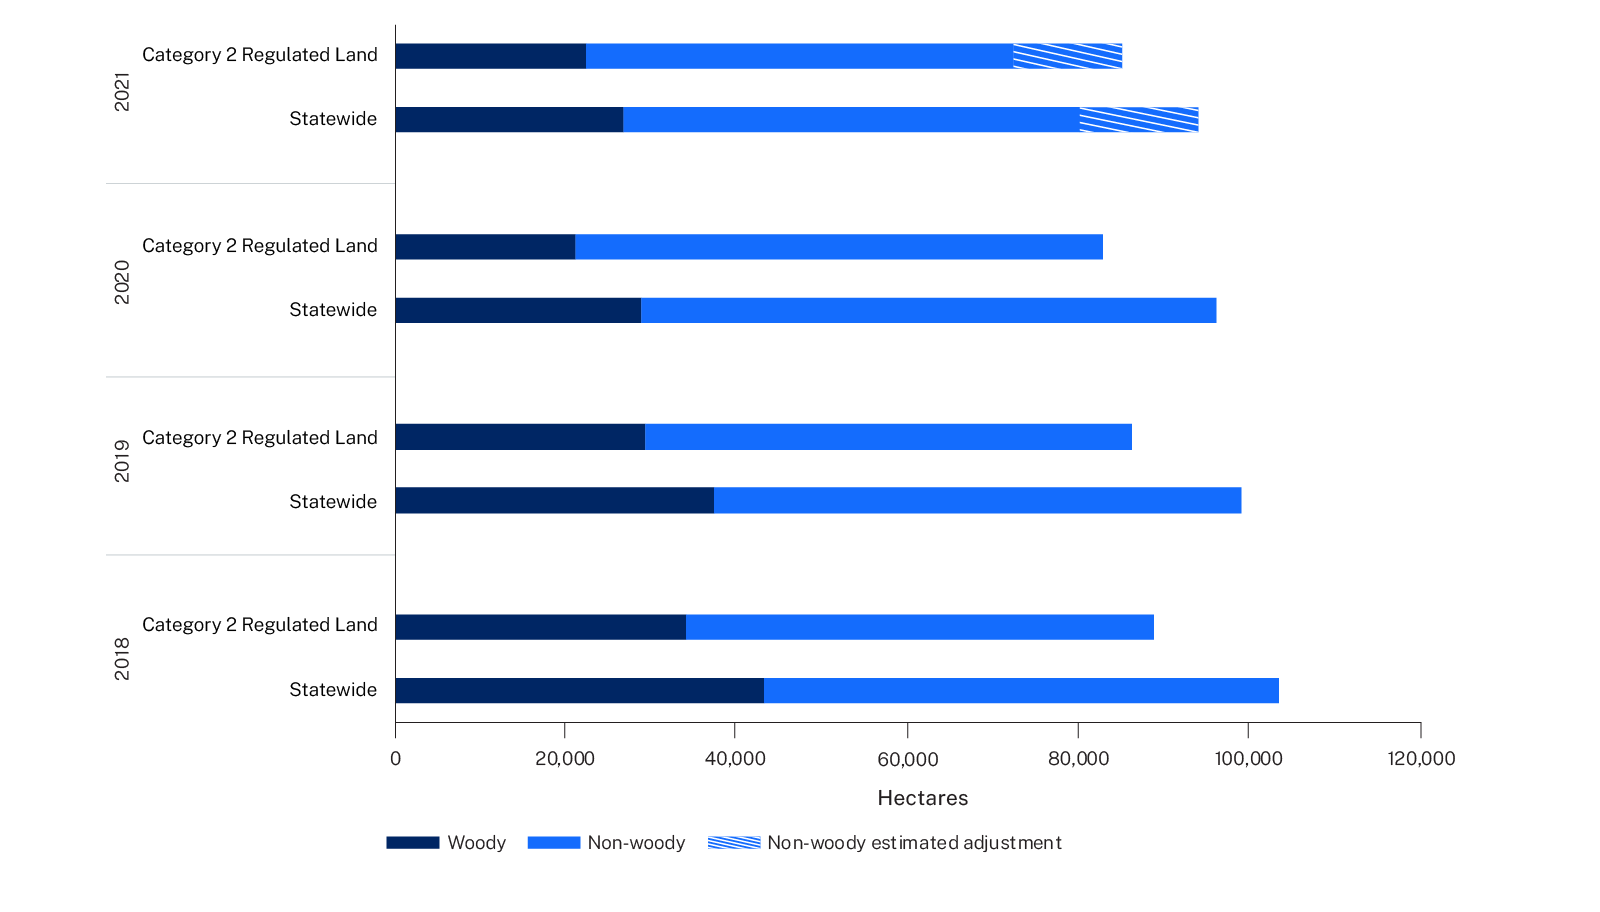
Figure 4 shows vegetation clearing authorisations for 2021 split by woody and non woody vegetation structure. The non woody figures are preliminary as some additional non woody clearing events will be confirmed and added to 2021 in next year's clearing analysis. See How vegetation clearing is captured for more information.
Preliminary 2021 figures (see Figure 4) show, of the 72,335 ha of clearing detected on Category 2 regulated land, 39% of clearing was recorded as authorised or presumed authorised. Of this, 19% was authorised under the Local Land Services Act and 12% under the Native Vegetation Act 2003. A further 8% of clearing was presumed allowable under these Acts or authorised under other legislation.
The 61% of unallocated clearing is predominately non woody vegetation clearing events (55%) compared to woody vegetation clearing events (6%). Unallocated clearing refers to:
- lawful clearing or reduction in landcover on Category 2 regulated land that does not require approval, notification and/or keeping of records
- vegetation loss for which the department does not have access to spatial records that authorise or allocate the clearing to a particular land management activity and which cannot be presumed from visual cues in the imagery
- areas that have been potentially cleared unlawfully or are not fully compliant with approvals.
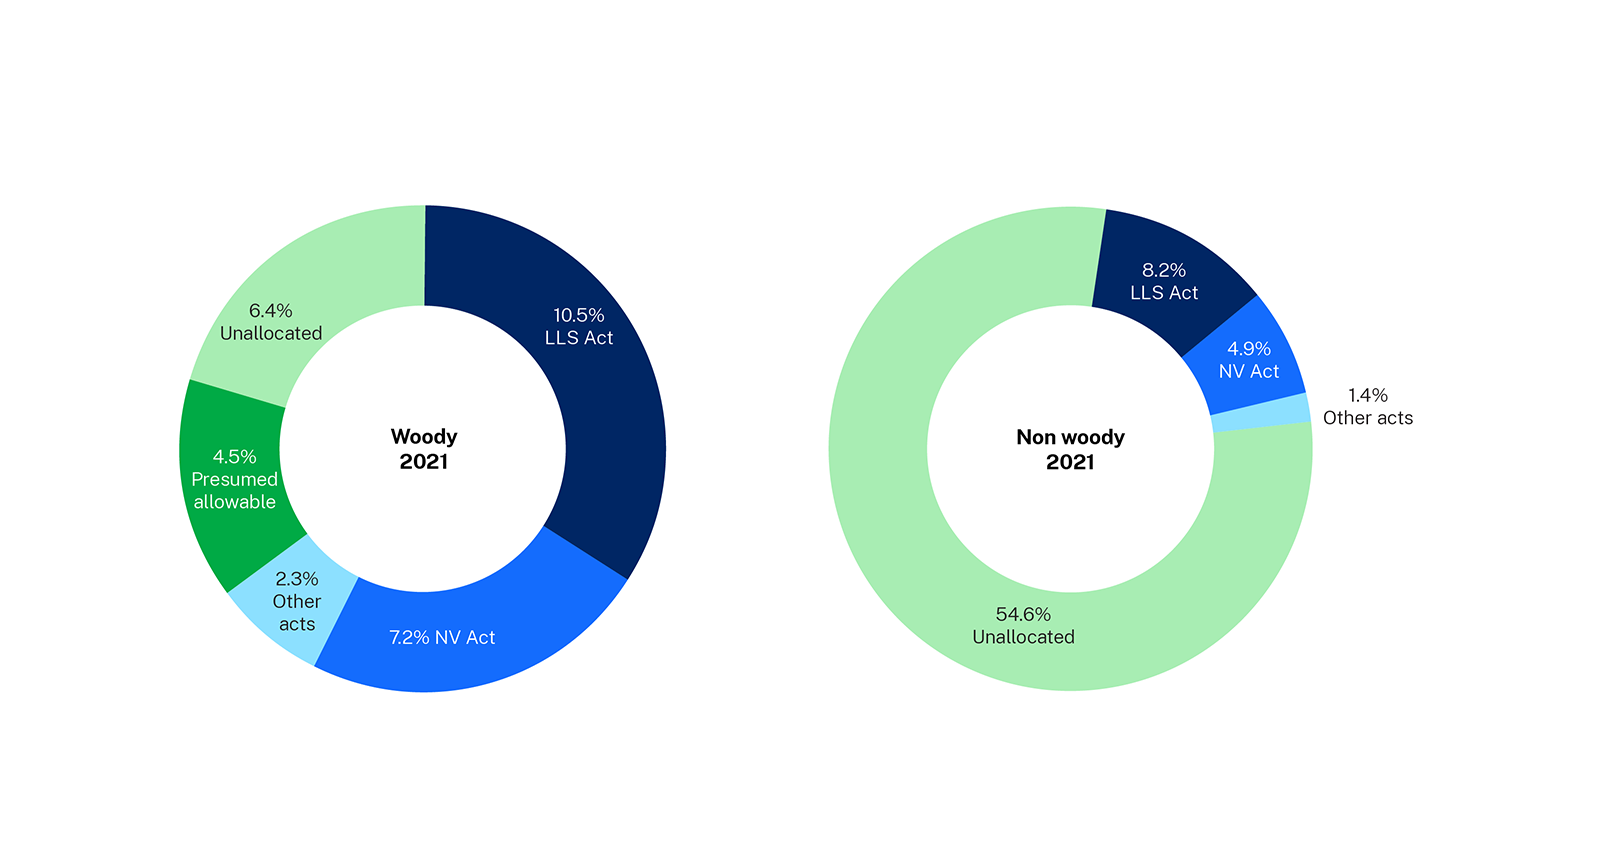
Figure 4 2021 vegetation clearing by authorisation and structure
The land management framework gives landholders greater flexibility and discretion to undertake routine land management activities without seeking approval. Consequently, several options for clearing without specific approval are permissible under the current land management framework.
These options include:
- provisions for landholders to remove native vegetation for routine farm management (allowable activities)
- land management activities under the Land Management Code that do not require certification or notification (managing woody native regrowth in managed native pastures)
- landholder self-assessment of the level of disturbance of grasslands or ground cover
- other legislative exceptions.
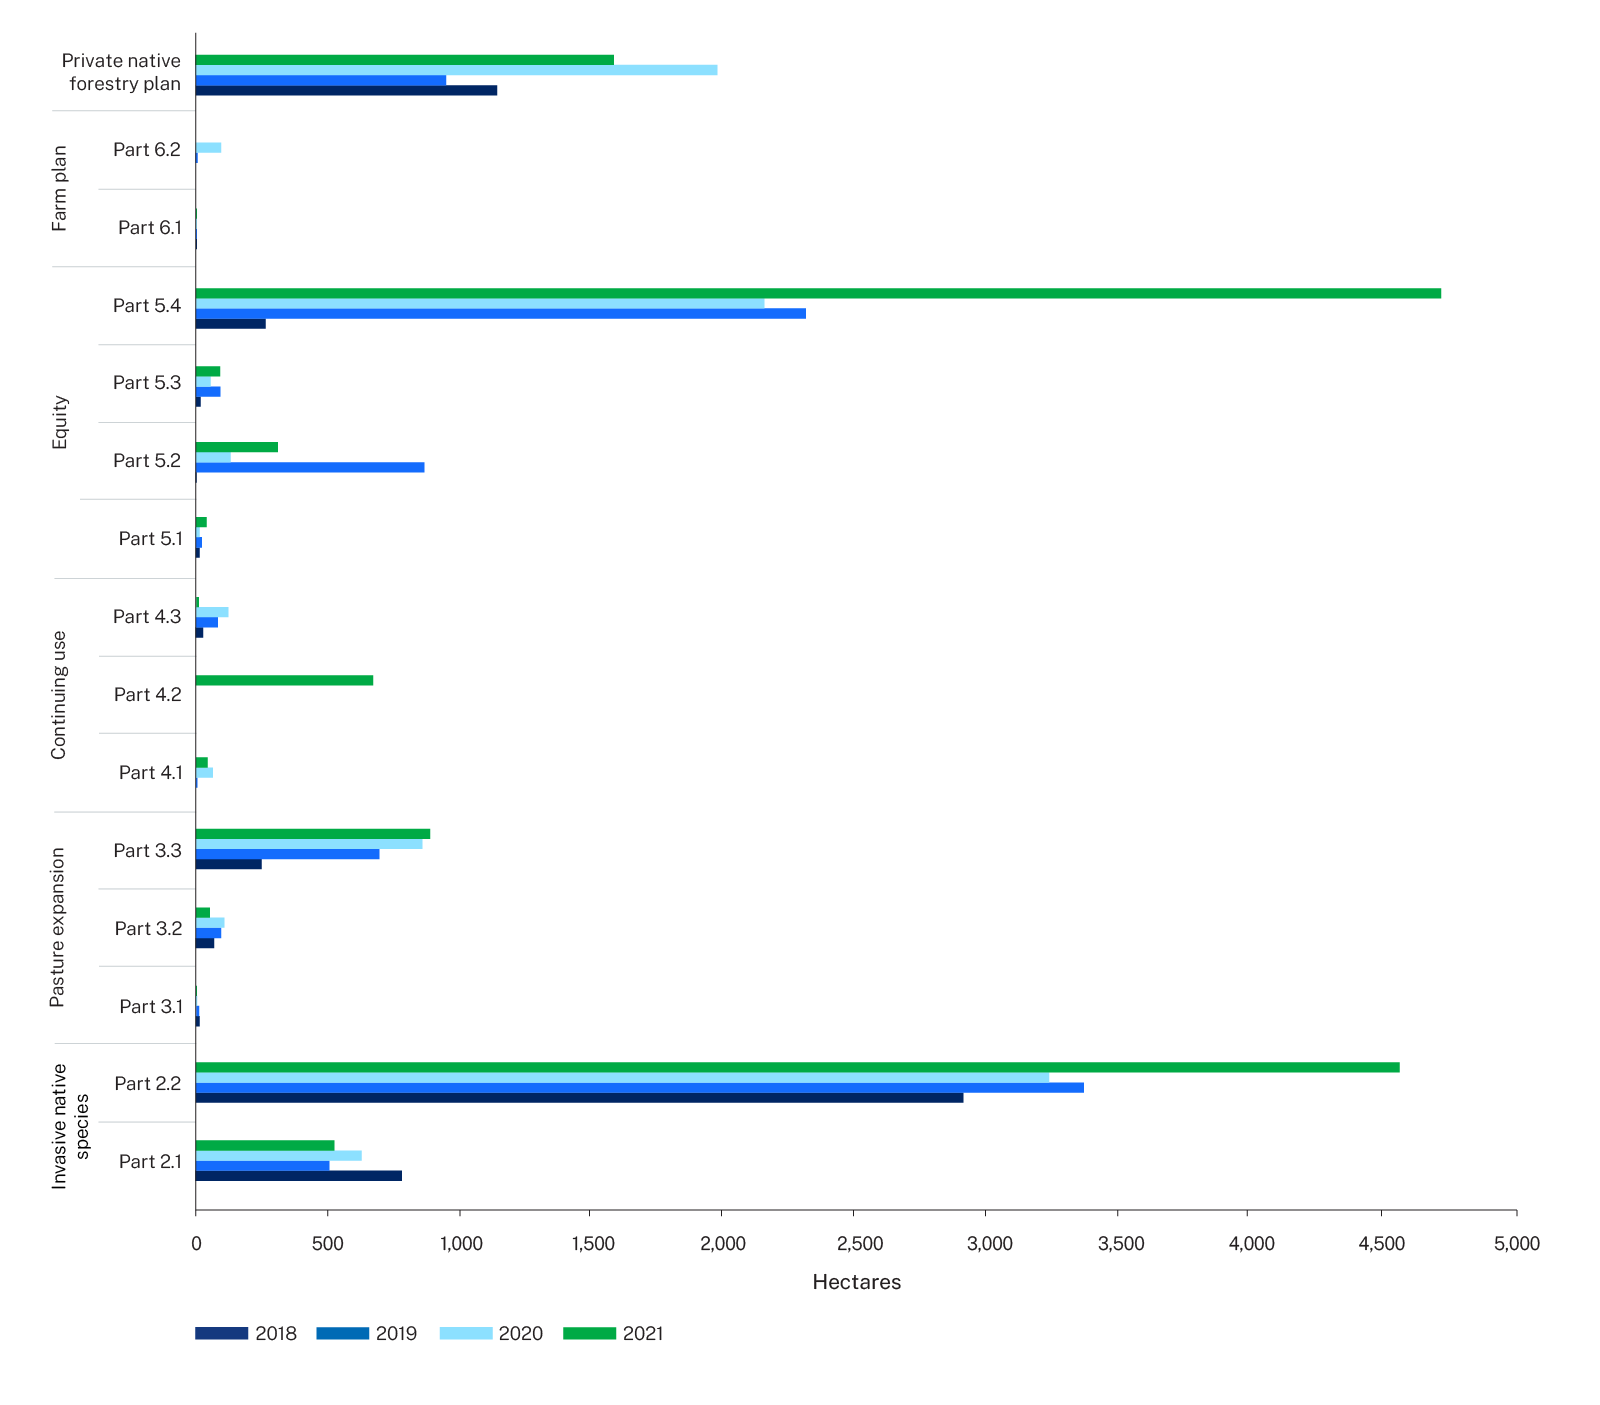
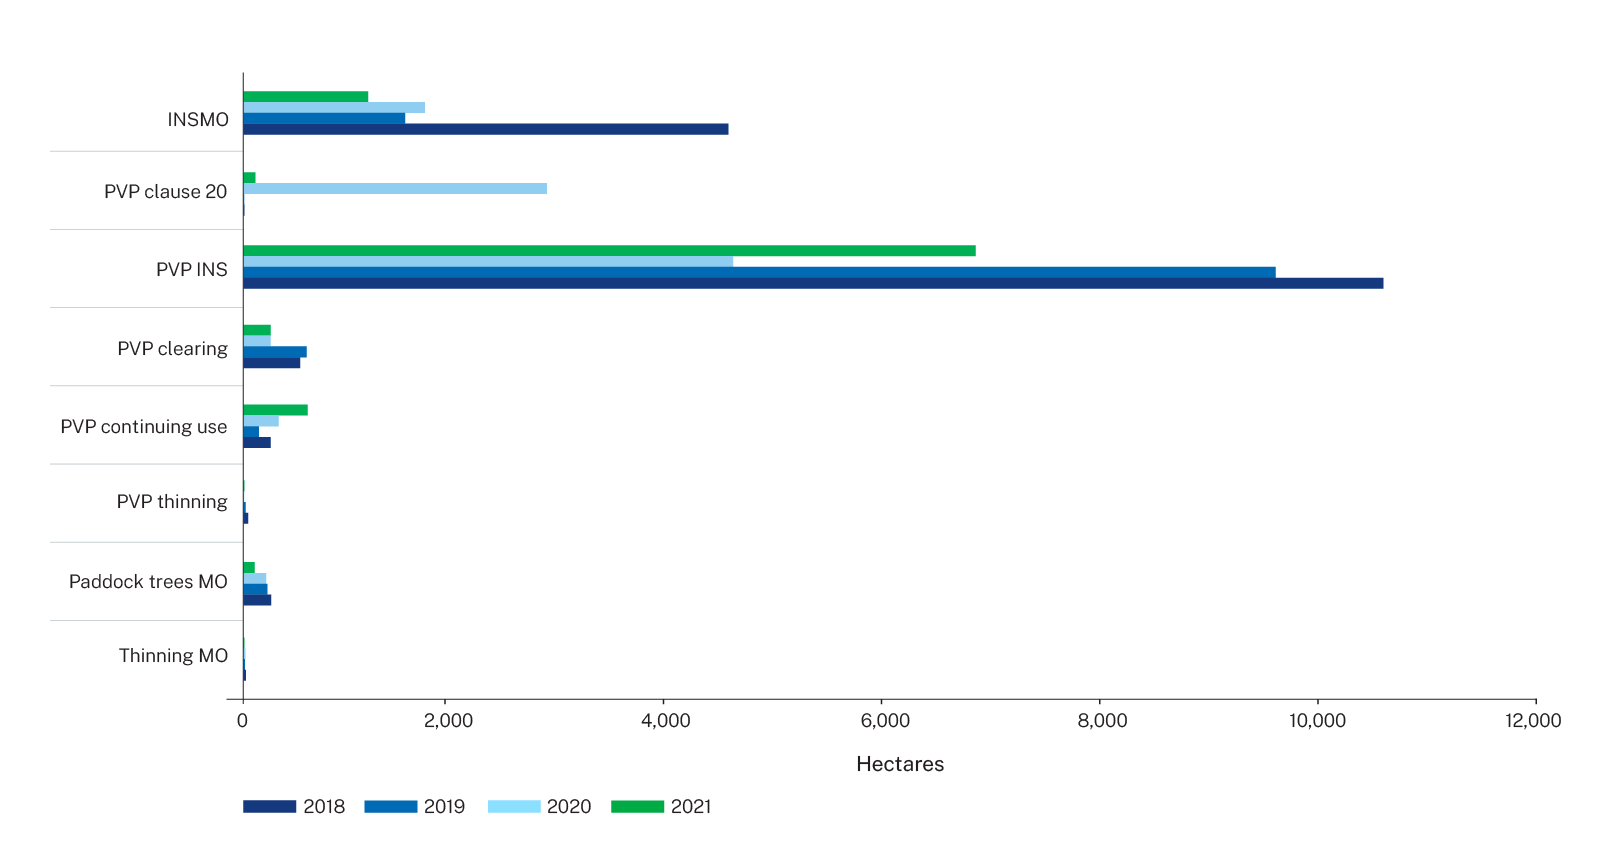
Analysis of 2018–20 vegetation clearing against the existing and new authorisation categories shows increased clearing under the Local Land Services Act and away from Native Vegetation Act approvals (Figure 5). Preliminary data for 2021 suggests a continuation of this trend. Each year approximately 4-5% of clearing is presumed allowable activities, and 4% authorised under other Acts.
Unallocated clearing has remained constant at 68% of total clearing between 2018 and 2020. In 2021, 61% of clearing was unallocated. This will increase with additional non woody clearing confirmed in the 2022 report.
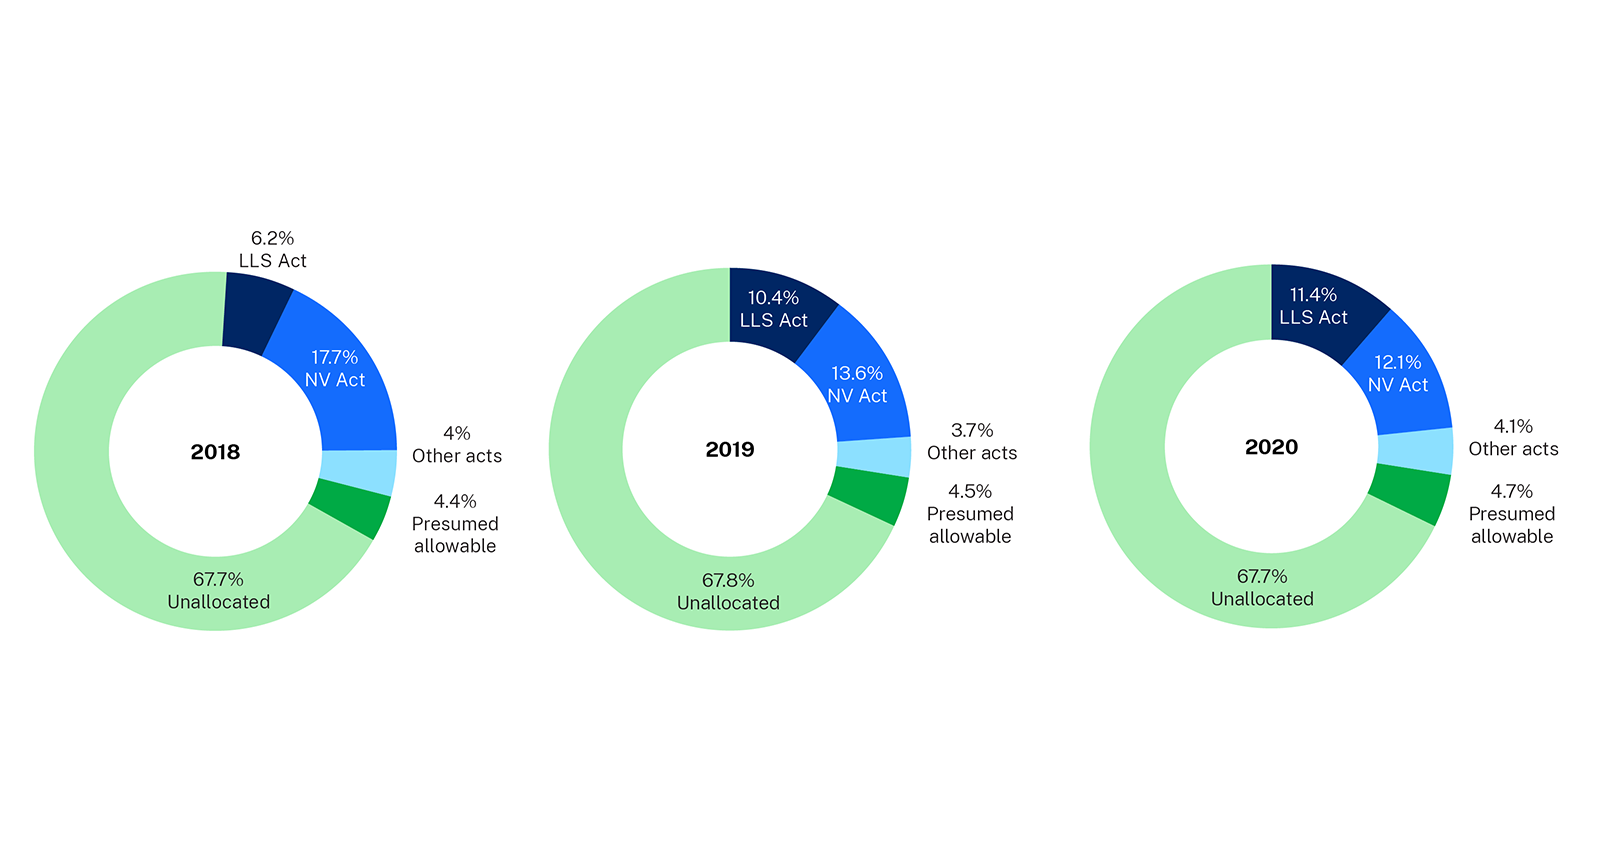
Figure 5 2018–20 vegetation clearing by authorisation