NSW Annual Air Quality Statement 2019

Air quality in New South Wales was greatly affected by the continuing intense drought conditions and unprecedented extensive bushfires during 2019, resulting in poorer air quality throughout the State.

Summary

Air quality in New South Wales (NSW) was greatly affected by the continuing intense drought conditions and unprecedented extensive bushfires during 2019. The poorer air quality than 2018 was primarily due to elevated particle pollution throughout the State.

The bushfire emergency saw around 4 million hectares burnt in NSW from July to December 2019, resulting in widespread smoke impacts on many regions through spring and early summer. In addition, continuing intense drought has led to an increase in widespread dust events throughout the year. A further source of particles came from hazard reduction burns in and around Sydney in the cooler months.

Levels of nitrogen dioxide, sulfur dioxide and carbon monoxide easily met national standards, with the exception of an exceedance of the hourly nitrogen dioxide standard at the new Goulburn station during the bushfire emergency period.

Ozone levels increased compared with the previous year, due to effects of warm and dry weather and climatic conditions together with other factors such as emissions from extensive bushfires in the year, meeting the national standards on 91% of all days.

Air quality levels vary across the State depending on regions. Overall, air quality met standards for 91% of days during the year on the Central Coast down to 60% of days in the Northern Tablelands.

Ozone exceeded national standard levels on 29 days in 2019 (meeting the standards 92% of the time) in the Greater Metropolitan Region (GMR), compared with 7 days in 2018. There were an additional 4 days in regional NSW when ozone levels at either Goulburn or Gunnedah exceeded the national standards.

Particle pollution (PM10 and PM2.5 – airborne particulate matter less than or equal to 10 and 2.5 micrometres in diameter, respectively) increased due to more frequent exceptional events, such as bushfires and dust storms. Hazard reduction burning, to manage bushfire risk, also resulted in poor air quality in the Sydney region on some days during autumn and winter.


Focus areas

The 2019 Air Quality Statement has 4 focus areas:

  • Hunter Valley
  • Stockton
  • Bushfires
  • Dust storms

Find out more

All regions experienced days of poor air quality due to particles. In 2019:

  • The Air Quality Index (AQI) reached the hazardous category (with an AQI greater than 200) on a total of 115 days, compared with 59 days in 2018 (Note: The AQI includes measurements for visibility. The count in both years includes the new monitoring station at Armidale and the Upper Hunter stations at Muswellbrook, Singleton and Aberdeen; and excludes Stockton, Carrington and Mayfield. For more information, see Focus areas – Hunter Valley tab.)
  • Daily PM10 levels were over the standard at one or more metropolitan or regional population centres on 135 days in 2019, compared with 64 days in 2018, excluding Stockton. There was an additional 29 days at Stockton, where particles are often due to sea salt.
  • Daily PM2.5 levels were over the standard at one or more metropolitan or regional population centres on 118 days in 2019, compared with 52 days in 2018.
  • Exceptional events led to poor air quality on 127 days, compared with 50 days in 2018:
    • Bushfires or hazard reduction burns contributed to particle levels on 97 days (26 days in 2018).
    • Dust storms contributed to particle levels on 73 days (25 days in 2018).

Note that exceptional events may have affected air quality at a site due to a combination of sources (e.g., bushfire smoke and dust) and the sources may have varied between regions.

Local sources of air pollution, including mining, industrial activity and domestic wood heaters, affected air quality in some regions, particularly in the North-West Slopes, Northern Tablelands and the Hunter region.

Annual average PM10 levels:

  • were above the national standard at 17 of the 36 sites with available annual average data, across all regions in New South Wales, except the Central Coast.
  • met the national standard at 19 of the 36 sites located within the Sydney, Illawarra, Central Coast, Lower Hunter, North-west Slopes and South-west Slopes regions.
  • were higher across the State compared with 2018, due to the impacts of continuing intense drought conditions and the bushfire emergency in 2019
  • ranged from 19.5 µg/m3 at Albion Park South in the Illawarra region to 43.6 µg/m3 at Stockton in the Port of Newcastle during 2019.

Annual average PM2.5 levels:

  • were above the national standard at 35 of the 36 sites with available annual average data in New South Wales.
  • met the national standard at Narrabri, in the North-west Slopes region
  • were higher across the State compared with 2018, due to widespread smoke from extensive bushfires during the late spring to summer (bushfire emergency) and the increase in particles throughout the State due to the continuing intense drought. Hazard reduction burns around Sydney also contributed to PM2.5 levels.
  • ranged from 7.8 µg/m3 at Narrabri in the North-west Slopes to 17.2 µg/m3 at Armidale in the Northern Tablelands during 2019.

Air quality records broken in 2019

The year 2019 set a few highest records in NSW since 1994:

  • highest daily average PM2.5 level (442.7 µg/m3) in NSW since 1994, recorded at the temporary Port Macquarie bushfire emergency monitoring station on 15 November 2019 (during the bushfire emergency period). This surpassed the previous record of 415.6 µg/m3 from Wallsend on 23 September 2009 (during 2009 Red Dawn dust event).
  • highest annual average PM2.5 level (17.2 µg/m3) in NSW since 1994, recorded at Armidale in 2019. This surpassed the previous record of 11.9 µg/m3 from Liverpool in 2002. Armidale’s PM2.5 levels were elevated by smoke from domestic wood heaters in winter and bushfire smoke in spring and early summer.
  • highest annual average PM10 level (43.6 µg/m3) in NSW since 1994, recorded at Stockton, in the Port of Newcastle, in 2019. This surpassed the previous record of 38.7 µg/m3 from the same station in 2018. Due to its proximity to the coast, elevated PM10 levels at the Stockton station often occur due to sea salt under onshore winds. The levels in 2019 were also largely affected by dust and bushfire smoke in spring and early summer.
  • highest hourly average NO2 level (16.1 pphm) in NSW since 1994, recorded at Goulburn on 31 December 2019 (during the bushfire emergency period). This surpassed the previous record of 13.3 pphm from Bringelly on 15 January 1996.
  • highest 8-hour average CO level (9.6 ppm) in NSW since 1994, recorded at the temporary Port Macquarie bushfire emergency monitoring station (during the bushfire emergency period) on 15 November 2019. This surpassed the previous record in 1994-2018 recorded at non-roadside sites, which was 9.1 ppm from Campbelltown West on 21 October 2013 during the 2013 New South Wales bushfire emergency.

Note:

  1. The number of stations and the starting date of individual stations in the network have varied over time.
  2. The national goals for particle pollution exclude exceptional events – the state of compliance in 2019 with the national air quality goals will be reported in a separate report according to the requirements of the National Environment Protection (Ambient Air Quality) Measure(AAQ NEPM).

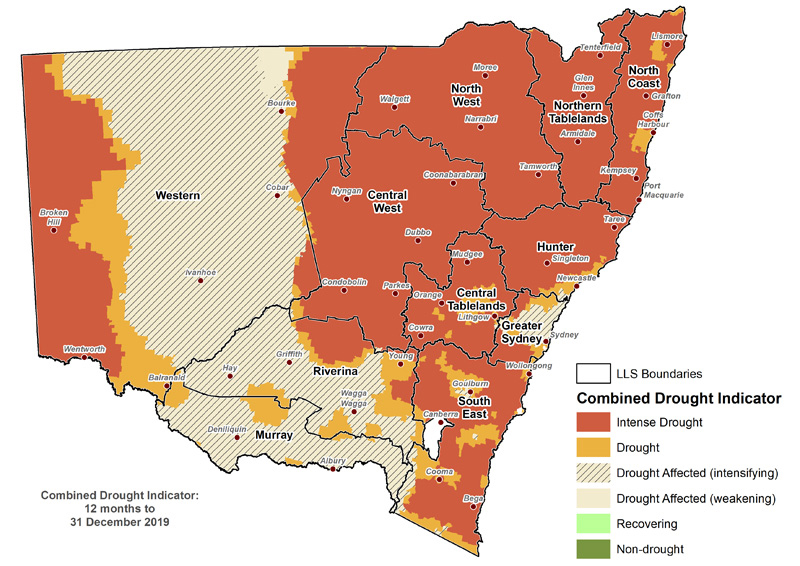
In 2019, New South Wales experienced record temperatures and persistent dry conditions, with more than 95% of the State drought-declared for the entirety of 2019. In January to April and October to December, the State was more than 99% drought-declared.

The Bureau of Meteorology reported 2019 was the warmest and driest year on record for Australia as a whole and for New South Wales. Australia’s average mean temperature in 2019 was 1.52 °C above average. Rainfall deficiencies across large parts of the country continued to increase, exacerbating drought and fire weather conditions.

Summer 2018-2019 was the warmest summer on record with very much below average rainfall across the northern two-thirds of the State. The State experienced several heatwave events and saw many records broken, with the statewide mean, minimum and maximum temperatures exceeding previous records by more than half of a degree.

Autumn 2019 was the fourth-warmest autumn on record for NSW. Total rainfall for the State was 32% below the long-term autumn average, with scattered areas of above average totals particularly over the northwest.

Winter 2019 experienced the fourth-lowest total rainfall on record since 1982, 62% below average, and lowest rainfall on record for the northern inland parts of the State. The mean maximum temperature for the State was 1.44ºC above average and the fifth-warmest winter on record. Mean maximum temperatures were very much above average in the east, and record high in parts of the northeast of the State.

Spring 2019 was the sixth driest on record for the State, with rainfall around 61% below average and more than half of NSW recording very much below average rainfall. Above average daytime temperatures were seen across much of the State with temperatures typically more than 3°C above average over parts of the east. Minimum temperatures were very much below average across the south of the State. Heatwave conditions in late November brought the highest temperatures on record for some locations in the south. The warmest temperature for the season was recorded on 21 November, with a Statewide average of 39.4°C. New South Wales was 100% drought-declared in November (NSW Department of Primary Industry Combined Drought Indicator - November 2019).

December 2019 saw record high temperatures for the month and repeated bursts of very hot days. Some locations broke the existing highest daily maximum for December on multiple days. The State’s mean temperature for December was the highest on record, at 3.32°C above average, about 0.4°C warmer than the previous highest in 2018. December rainfall was 85% below average, the second lowest on record and the lowest since 1938. The NSW Department of Primary Industry’s Combined Drought Indicator showed 100% of NSW in drought in December. The record high temperatures, severe rainfall deficiencies and very low humidity brought nearly all of New South Wales its highest December Forest Fire Danger Index values.

Map of the Department of Primary Industries verified NSW conmbined drought indicator - 12 months to 30 November 2019


Air quality in New South Wales met national standards between 60% and 91% of the time across regions in 2019. There was an increase in the number of days reaching hazardous pollution levels compared with 2018.

The Air Quality Index (AQI) was in the ‘very good’, ‘good’ or ‘fair’ category for 60% of the time in the Northern Tablelands, 75% in the Central Tablelands, 79% to 86% in the Sydney regions, 81% in the South-west Slopes and Upper Hunter, 82% in the North-west Slopes, and 87% to 91% of the time in all other regions (Lower Hunter, Illawarra and Central Coast). The ‘very good’ to ‘fair’ AQI categories represent the amount of time air quality met relevant standards.

Widespread smoke and dust storms significantly affected air quality levels throughout the State, particularly during the bushfire emergency period from late October 2019.

Sydney air quality was also affected by smoke from hazard reduction burns during the cooler months.

Air quality in Armidale, within the Northern Tablelands region, is often affected by smoke from domestic wood heaters during the cooler months.


Note: Rounding calculations may contribute to the totals at some sites not adding up to 100%. Southern Tablelands is not included due to the short data availability for the year (the Goulburn site commenced on 6 November 2019).

Note: Lower Hunter AQI comprises Beresfield, Newcastle and Wallsend, Upper Hunter AQI comprises Aberdeen, Muswellbrook and Singleton. Visibility (NEPH) is not measured in the Upper Hunter.


Days with hazardous air quality levels

In 2019, AQI levels reached the hazardous category (with an AQI greater than 200) on a total of 115 days, compared with 59 days in 2018 (Note: The AQI includes measurements for visibility. The count in both years includes the new monitoring station at Armidale and the Upper Hunter stations at Muswellbrook, Singleton and Aberdeen; and excludes Stockton, Carrington and Mayfield. For more information, see Focus areas – Hunter Valley tab.)

During 2019, there were:

  • 67 hazardous days when bushfire smoke affected particle levels at sites in one or more regions. These occurred in the warmer months, with the majority during the bushfire emergency period from October 2019.
  • 36 hazardous days when dust storms affected particle levels at sites in one or more regions. These occurred in January to March and August to December (DustWatch publications).
  • 16 hazardous days when smoke from hazard reduction burns affected particles, predominantly in Sydney, but also one day in the Central Coast. These occurred from April to August (outside of the bushfire danger period).
  • 18 hazardous days when smoke from domestic wood heaters affected particle levels, predominantly in Armidale, but also in Orange. These were observed during the cooler months from May to September, typically overnight under calm cold conditions.

Note that on any day, hazardous levels at a site may have been affected by a combination of different sources (for example bushfire smoke and dust) and the sources may have varied between regions.

In Sydney, there were 53 hazardous particle days. Most of these days (37 days, 70%) occurred from 30 October to 31 December. These were predominantly affected by smoke from the extensive bushfires burning throughout New South Wales during the bushfire emergency period. A further 15 days (28%) were due to smoke from hazard reduction burns from April to August. These fires were reported by the NSW Rural Fire Service.

Hazardous days for each region

  • Sydney had 53 hazardous days in total:
    • 33 days due to bushfires: October (1), November (9) and December (23)
    • 15 days due to hazard reduction burns: April (5), May (6), June (3), August (1)
    • 4 days due to a combination of smoke from bushfires and dust storms: October (1), November (2) and December (1)
    • 1 day due to a local fire adjacent to the St Marys monitoring station: June.
  • Illawarra had 17 hazardous days in total:
    • 12 days due to smoke from bushfires: October (1), November (2) and December (9)
    • 2 days due to a combination of smoke from bushfires and dust storms: November
    • 1 day due to a dust storm: February
    • 1 day due to hazard reduction burns: June
    • 1 day due to a localised unidentified source at Kembla Grange: June.
  • Central Coast had 18 hazardous days in total:
    • 14 days due to bushfires: October (1), November (6) and December (7).
    • 3 days due to a combination of smoke from bushfires and dust storms: October (1) and November (2)
    • 1 day due to hazard reduction burns: May.
  • Lower Hunter had 26 hazardous days in total:
    • 20 days due to bushfires: January (2), September (1), October (2), November (7) and December (8)
    • 6 days due to a combination of smoke from bushfires and dust storms: October (1), November (2) and December (3)
  • Upper Hunter had 16 hazardous days in total:
    • 9 days due to bushfires: October (2), November (1) and December (6)
    • 5 days due to a combination of smoke from bushfires and dust: November (4) and December (1).
    • 2 days due to dust storms: October (1) and December (1)
  • North West Slopes had 29 hazardous days in total:
    • 16 days due to bushfires: January (1), October (2), November (4) and December (9)
    • 10 days due to dust storms: February (1), August (1), September (1), October (3), November (3) and December (1)
    • 3 days due to a combination of smoke from bushfires and dust storms: November.
  • Northern Tablelands had 54 hazardous days in total:
    • 30 days due to bushfires: September (4), October (3), November (10) and December (13)
    • 16 days due to smoke from domestic wood heaters: May (1), June (7), July (5), August (2), September (1)
    • 5 days due to dust storms: August (1), September (1), November (2) and December (1)
    • 3 days due to a combination of smoke from bushfires and dust storms: November.
  • Central Tablelands had 34 hazardous days in total:
    • 23 days due to bushfires: November (3) and December (20)
    • 5 days due to a combination of smoke from bushfires and dust storms: October (1) and November (4)
    • 4 days due to dust storms: September (1), October (1), November (1) and December (1)
    • 2 days most likely due to smoke from domestic wood heaters: June (1) and July (1).
  • South West Slopes had 20 hazardous days in total:
    • 8 days due to dust storms: January (1), February (2), March (1), September (1), October (1) and November (2)
    • 7 days due to bushfires: December
    • 5 days due to a combination of smoke from bushfires and dust storms: November (1) and December (4).

Ozone pollution

National standards for ozone (O3)

One-hour and four-hour ozone averages

There were 33 days in 2019 when ozone levels were over the national standards at one or more sites in NSW, meeting the national standard on 91% of days.

Within the Greater Metropolitan Region (GMR, comprising Sydney, Lower Hunter, Central Coast and Illawarra regions), ozone levels were over the national standards on 29 days (meeting the standards 92% of the time). This was 22 more days than 2018 when the ozone standards were exceeded on 7 days.

Ozone levels peaked in the warmer months during January to February and October to December. Within the GMR, ozone events occurred on:

  • 28 days at one or more sites in the Sydney region
  • 5 days in the Lower Hunter region
  • 3 days each in the Central Coast and Illawarra regions.

In comparison, within the GMR, there were no ozone exceedances in the Central Coast and Illawarra regions in 2018.

The most extensive ozone events in 2019 are outlined below:

  • On 16 January 2019, ozone levels above the national standards were recorded at 9 sites in Sydney North-west and South-west regions due to a heatwave across New South Wales. The maximum hourly ozone was 13.8 pphm, recorded at Camden in Sydney South-west. The heatwave was caused by the persistence of a slow-moving high-pressure system over the Tasman sea. The maximum temperature on this day in Sydney was 39.4°C at Richmond in Sydney North-west.
  • On 26 January 2019, ozone levels above the national standards were recorded at 9 sites throughout Sydney due to heatwave conditions across New South Wales. The maximum hourly ozone was 11.4 pphm, recorded at Liverpool in Sydney South-west. The meteorological conditions were similar to the event day on 16 January 2019. The maximum temperature on this day in Sydney was 41.6°C at St Marys in Sydney North-west.
  • On 31 October 2019, ozone levels above the national standards were recorded at 10 sites in central and western Sydney due to smoke transported from bushfires in northern New South Wales. The maximum hourly ozone was 10.6 pphm, recorded at St Marys in Sydney North-west. A slow-moving high-pressure system over the Tasman sea created calm conditions along with northerly and north-easterly wind, which transported smoke from the fires in northern parts of the State. A strong temperature inversion in the morning trapped smoke in the Sydney basin which acted as an ozone precursor. The maximum temperature on this day was 32.5°C at St Marys in Sydney North-west.
  • On 10 December, 16 sites in the Sydney and Lower Hunter regions recorded ozone levels over the national standards. On this day, the hourly ozone concentration of 17.9 pphm at Earlwood was the third-highest recorded in NSW since 1994. North-easterly and north-westerly wind transported smoke from the bushfires to the Sydney basin. This was coupled with a strong temperature inversion in the morning, with smoke trapped in the Sydney basin and acting as an effective ozone precursor. The maximum temperature on this day was 41.1°C at Richmond in Sydney North-west.
  • On 19 December, the most extensive ozone event for 2019 occurred. On this day, 18 of the 21 available sites in the Sydney, Illawarra and Lower Hunter regions recorded ozone levels over the national standards. The maximum hourly ozone concentration of 17.9 pphm was observed at Rozelle, in the Sydney East, equalling the annual maximum recorded on 10 December 2019 at Earlwood. Westerly to north-westerly winds transported smoke from bushfires at Warragamba and the Blue Mountains into the Sydney basin. The Illawarra region was impacted by smoke from bushfires at Warragamba. The Lower Hunter region was affected by the bushfire smoke from Wollemi National Park and fires in the NSW North Coast. The large quantities of smoke in these regions on this day acted as an ozone precursor. The maximum temperature on this day was 41.8°C at St Marys in Sydney North-west.

In NSW regional centres, monitoring stations were established at Gunnedah (North-west Slopes) in March 2018 and Goulburn (Southern Tablelands) in November 2019:

  • At Gunnedah, ozone levels exceeded the national standards on 2 days in December 2019. These events were associated with extensive bushfire smoke and high temperatures during the bushfire emergency period. There were no days recorded over the standards in 2018.
  • At Goulburn, ozone levels exceeded the national standards on 4 days in December 2019. These events were associated with bushfire smoke transported from Warragamba, Wollemi National Park and the New South Wales South Coast.

Days above the 1-hour and 4-hour ozone standards – 2019

Date Stations exceeding the 1-hour average ozone standard (10 pphm) Stations exceeding the 4-hour average ozone standard (8 pphm)

04/01/2019

Bringelly (10.3), Camden (10.4)

Bargo (9.6), Bringelly (8.5), Camden (9.1), Campbelltown West (8.2), Oakdale (8.4)

15/01/2019

Bargo (12.8), Camden (11.6), Campbelltown West (11.4), Oakdale (10.3), St Marys (11.5)

Bargo (10.7), Camden (10.1), Campbelltown West (10.6), Oakdale (9.1), Prospect (8.3), St Marys (9.3)

16/01/2019

Camden (13.8), Campbelltown West (10.8), Oakdale (11.6), Prospect (11.1), Richmond (13.7), St Marys (13.7)

Bargo (8.2), Camden (11.1), Campbelltown West (9.1), Liverpool (8.6), Oakdale (10.2), Parramatta North (8.2), Prospect (10.0), Richmond (12.0), St Marys (11.8)

17/01/2019

Bargo (11.3), Camden (11.0), Campbelltown West (10.7), Oakdale (11.6)

Bargo (9.0), Camden (9.4), Campbelltown West (8.8), Oakdale (9.2), Prospect (8.6), St Marys (9.2)

18/01/2019

Bargo (10.7), Campbelltown West (10.7)

Bargo (8.9), Bringelly (8.4), Campbelltown West (9.3), Liverpool (8.6), Oakdale (8.1)

22/01/2019

Bargo (10.9)

Bargo (9.7), Bringelly (8.4), Camden (8.7), Campbelltown West (8.8), Oakdale (8.4)

25/01/2019

-

Bargo (8.2), Bringelly (8.2)

26/01/2019

Liverpool (11.4)

Bringelly (9.3), Camden (9.0), Campbelltown West (8.3), Liverpool (9.4), Macquarie Park (8.4), Oakdale (8.3), Parramatta North (8.1), Prospect (8.6), St Marys (9.8)

29/01/2019

-

Bringelly (8.5), Camden (8.5), Campbelltown West (8.9), St Marys (8.3)

18/02/2019

-

Bargo (8.1), Bringelly (8.4), Camden (8.2), Campbelltown West (8.3)

31/10/2019

Bringelly (10.4), Camden (10.3), St Marys (10.5)

Bargo (8.1), Bringelly (9.6), Camden (9.7), Campbelltown West (8.8), Chullora (8.1), Liverpool (8.6), Parramatta North (8.8), Prospect (8.8), Rouse Hill (8.3), St Marys (9.4)

01/11/2019

Bringelly (10.4), Camden (10.3), Oakdale (10.8), St Marys (10.6)

Bargo (8.9), Bringelly (9.0), Camden (9.1), Campbelltown West (8.6), Oakdale (9.5), Parramatta North (8.6), Prospect (8.9), St Marys (9.3)

18/11/2019

-

Richmond (9.1), Rouse Hill (8.3), St Marys (8.3)

19/11/2019

-

Kembla Grange (9.2), Randwick (8.8), Rozelle (8.3), Wollongong (9.1)

21/11/2019

Bargo (12.6), Bringelly (10.4), Camden (12.1), Campbelltown West (10.5), Oakdale (14.7), Richmond (12.0), St Marys (12.0)

Bargo (12.5), Bringelly (9.9), Camden (11.5), Campbelltown West (10.2), Oakdale (13.0), Parramatta North (8.2), Richmond (11.4), St Marys (11.0)

28/11/2019

-

Richmond (8.4)

29/11/2019

-

Bringelly (8.2), Camden (8.5), Kembla Grange (9.0), Parramatta North (8.4), Richmond (8.2)

03/12/2019

-

Bringelly (8.2), Campbelltown West (8.3), Earlwood (8.1), Liverpool (8.7), Randwick (8.4)

04/12/2019

-

Bringelly (8.4), Chullora (8.4), Earlwood (8.4), Liverpool (8.4), Macquarie Park (8.7), Parramatta North (8.3), Randwick (8.1), Rozelle (8.1), Wyong (8.4)

05/12/2019

Newcastle (10.2), Randwick (11.2)

Newcastle (9.2), Randwick (10.3), Wallsend (8.3), Wyong (9.0)

07/12/2019

-

Richmond (8.4)

09/12/2019

St Marys (11.0)

Bargo (8.4), Goulburn (8.6), St Marys (9.5)

10/12/2019

Bargo (12.0), Bringelly (14.4), Camden (10.2), Campbelltown West (12.3), Chullora (17.6), Earlwood (17.9), Liverpool (15.7), Macquarie Park (12.2), Parramatta North (15.7), Prospect (13.2), Richmond (11.6), Rouse Hill (11.2), Rozelle (12.5), St Marys (12.3)

Bargo (9.6), Beresfield (8.2), Bringelly (11.1), Camden (9.2), Campbelltown West (10.6), Chullora (11.9), Earlwood (11.2), Liverpool (11.5), Macquarie Park (10.3), Parramatta North (12.2), Prospect (11.6), Richmond (10.3), Rouse Hill (10.1), Rozelle (9.5), St Marys (11.4), Wallsend (8.1)

19/12/2019

Bringelly (11.0), Camden (11.5), Campbelltown West (13.1), Chullora (15.4), Earlwood (15.7), Liverpool (11.4), Macquarie Park (11.2), Newcastle (10.4), Parramatta North (13.2), Prospect (13.1), Randwick (15.0), Rouse Hill (10.8), Rozelle (17.9), St Marys (11.4), Wallsend (10.5), Wollongong (11.1)

Beresfield (8.7), Bringelly (9.7), Camden (9.3), Campbelltown West (10.8), Chullora (12.1), Earlwood (12.5), Liverpool (9.6), Macquarie Park (10.5), Newcastle (9.7), Oakdale (8.7), Parramatta North (11.9), Prospect (12.2), Randwick (11.2), Rouse Hill (9.8), Rozelle (14.9), St Marys (10.7), Wallsend (9.7), Wollongong (9.4)

20/12/2019

Goulburn (14.7)

Goulburn (13.7), Gunnedah (8.7)

21/12/2019

Beresfield (12.6), Bringelly (10.3), Camden (11.4), Campbelltown West (12.9), Liverpool (10.6), Oakdale (10.6), Prospect (11.2), Wallsend (11.0)

Beresfield (10.7), Bringelly (9.6), Camden (10.6), Campbelltown West (11.7), Liverpool (9.5), Oakdale (9.6), Prospect (9.5), St Marys (8.9), Wallsend (8.4)

23/12/2019

-

Goulburn (8.2)

24/12/2019

-

Gunnedah (8.2)

27/12/2019

Goulburn (11.6)

Goulburn (9.4)

28/12/2019

-

Bargo (8.2), Campbelltown West (8.2)

29/12/2019

-

Beresfield (8.4)

30/12/2019

Richmond (10.1)

Bargo (8.5), Bringelly (8.2), Camden (8.2), Oakdale (9.5), Parramatta North (8.2), Prospect (8.8), Richmond (9.8), Rouse Hill (9.3), St Marys (9.4)

31/12/2019

Camden (10.7), Campbelltown West (10.9), Oakdale (10.6)

Camden (9.7), Campbelltown West (9.7), Oakdale (10), Wyong (9.0)

Note: Values in brackets are the actual maximum ozone levels at each station on the day. pphm = parts per hundred million in volume.  Ozone data from the new Goulburn air quality monitoring station are available from 6 November 2019. "-" indicates no exceedance recorded.

Nitrogen dioxide pollution

National standards for nitrogen dioxide (NO2)

One-hour nitrogen dioxide averages

The 1-hour standard for NO2 was met on 99.7% of days in 2019, with 1 day above the standard on 31 December 2019 at the new Goulburn monitoring station in the Southern Tablelands (monitoring commenced on 6 November 2019). This was the first exceedance of the NO2 standard since an early exceedance on 26 February 1998, which occurred at Lidcombe in Sydney East.

On 31 December, at 7pm, hourly average NO2 levels at Goulburn reached 16.1 pphm, the highest recorded value since 1994. This event was caused by a southerly change, which concentrated smoke from the large Currowan and Palerang fires on the south coast and moved it through the Southern Tablelands and towards Canberra. This event occurred at the same hour when the second highest nephelometer (visibility) reading recorded in the NSW network (with the highest being an atypical high reading at Earlwood in 2011 that was caused by a car fire adjacent to the monitoring station).

A similar southerly change on 21 December 2019 resulted in NO2 levels close to the hourly standard, reaching 11.8 pphm at Goulburn. This occurred at the same hour when the third highest nephelometer (visibility) reading recorded across the NSW network, associated with the impact of smoke and strong southerly winds on air quality in Southern Tablelands during December 2019.

The Bradfield Highway roadside monitoring station, which measures air quality adjacent to one of the busiest roads in NSW (located to the north of the Sydney Harbour Bridge), recorded a maximum hourly NO2 level of 15.3 pphm on 19 December at 1pm. While there was some traffic influence present, Sydney air quality on this day was significantly impacted by smoke. Elevated concentrations (below the national standard) were recorded at other Sydney East stations around the same time, with a value of 9.0 pphm recorded at Rozelle at 3pm on the day.

Annual nitrogen dioxide averages

Annual average NO2 levels remained well below the national standard in 2019. The maximum annual average was 1.2 pphm, recorded at Liverpool in Sydney South-west and Chullora in Sydney East.

Sulfur dioxide pollution

National standards for sulfur dioxide (SO2)

  • One-hour average – 20 parts per hundred million (20 pphm)
  • Daily average – 8 parts per hundred million (8 pphm)
  • Annual average – 2 parts per hundred million (2 pphm)

One-hour sulfur dioxide averages

There were no days over the one-hour SO2 standard in 2019. The maximum hourly SO2 average was 13.0 pphm, recorded at Muswellbrook in the Upper Hunter on 15 October 2019.

Daily sulfur dioxide averages

There were no days over the daily SO2 standard in 2019. The maximum daily SO2 average was 2.4 pphm, recorded at Muswellbrook in the Upper Hunter on 21 April 2019.

Annual sulfur dioxide averages

Annual average SO2 levels remained well below the national standard in 2019. The maximum annual average was 0.3 pphm, recorded at Muswellbrook in the Upper Hunter and Stockton in the Port of Newcastle.

Carbon monoxide pollution

National standards for carbon monoxide (CO)

Eight-hour carbon monoxide averages

In 2019, long-term (non-roadside) monitoring stations had no days over the 8-hour CO standard. The maximum 8-hourly CO average was 3.6 ppm, recorded at Rouse Hill in Sydney North-west on 19 November 2019. Since 1994, the record high value of 9.1 ppm was measured at Campbelltown West in Sydney South-west on 21 October 2013 due to the impact of the 2013 bushfires in the Blue Mountains. However, it should be noted that a higher values were recorded at temporary stations in 2019 due to the bushfire emergency, on 6 days at Port Macquarie during November, and on 2 days at Katoomba during December. Two exceedances were measured at the temporary Port Macquarie bushfire emergency monitoring station, with a new record of 9.6 ppm recorded on 15 November 2019.

PM10 fine particle pollution

National standards for PM10

  • Annual average – 25 micrograms per cubic metre of air (25 µg/m3)
  • Daily average – 50 micrograms per cubic metre of air (50 µg/m3)

Annual average PM10 levels

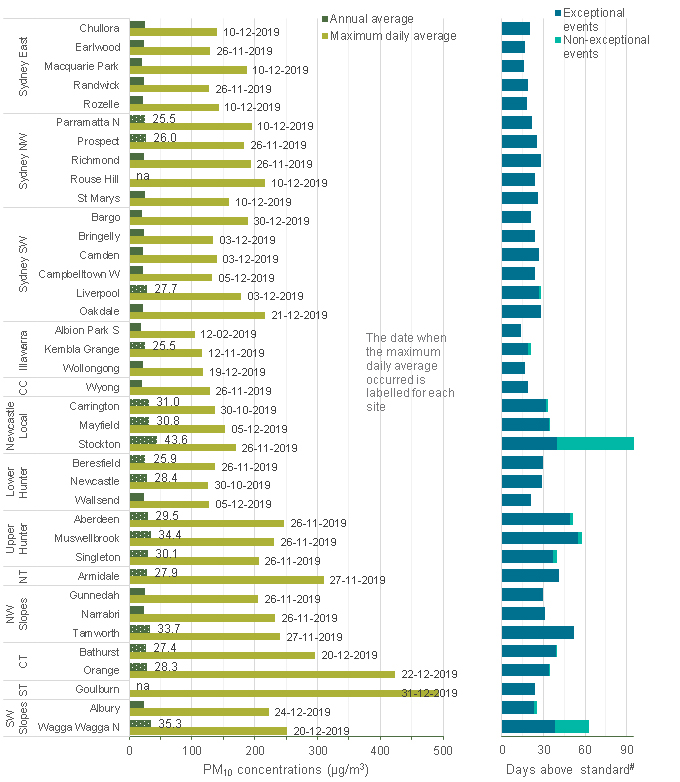
During 2019, annual average PM10 levels met the national standard at 19 of the 36 sites with available annual average data, located within the Sydney, Illawarra, Central Coast, Lower Hunter, North-west Slopes and South-west Slopes regions.

In 2019, 17 of the 36 sites with available annual average data in New South Wales exceeded the national PM10 annual average standard. These occurred at

  • Liverpool, Parramatta North and Prospect in the Sydney region
  • Kembla Grange in the Illawarra
  • Beresfield and Newcastle in the Lower Hunter
  • Stockton, Carrington and Mayfield in the Port of Newcastle
  • Aberdeen, Muswellbrook and Singleton (the 3 large population sites) in the Upper Hunter
  • Tamworth in the North-west Slopes
  • Armidale in the Northern Tablelands
  • Orange and Bathurst in the Central Tablelands
  • Wagga Wagga North in the South-west Slopes region.

Annual average PM10 levels ranged from 19.5 µg/m3 at Albion Park South in the Illawarra region to 43.6 µg/m3 at Stockton in the Port of Newcastle during 2019.

There was an increase in annual average PM10 concentrations at all stations, and an increase in the number of sites exceeding the annual average standard in 2019, compared with 2018. In 2018, the annual average PM10 levels ranged from 14.3 µg/m3 at Narrabri in the North-west Slopes region to 38.7 µg/m3 at Stockton in the Port of Newcastle, with 5 sites exceeding the annual average PM10 standard.

This increase was mainly due to the continuing intense drought conditions throughout the year (resulting in increased dust storm activities) and the bushfire emergency October–December, elevating particle levels throughout the State in 2019.

Historically, annual average PM10 levels are generally higher in the Upper Hunter and the Port of Newcastle due to local industrial activity, than elsewhere in the State. Wagga Wagga North, in the South-west Slopes, is another station which typically records high PM10 annual averages, particularly during drought affected years due to windblown dust. In 2019, other regional town centres, such as Tamworth in the North-west Slopes, recorded similar or higher levels compared to the major population centres in the Hunter regions. This was due to the increasing effect of dust from the long-running drought, and significant bushfire impact in North-west Slopes in October and November. More information about particle levels in the Hunter regions can be found in Focus areas – on the Hunter Valley tab.

Daily average PM10 levels

Daily PM10 levels were over the standard at one or more metropolitan or regional population centres on 135 days in 2019 (compared with 64 days in 2018), excluding Stockton. There were an additional 29 days when daily PM10 were over the standard solely at Stockton. All 38 air quality monitoring sites in metropolitan and regional population centres recorded days with PM10 levels above the national standard in 2019. The high number of daily PM10 exceedances was mainly driven by the intense drought conditions, extensive bushfires throughout New South Wales from spring and the increasing frequency of widespread dust storms throughout the year. Hazard reduction burns around Sydney from April to August also contributed to particle levels in 2019.

The maximum daily PM10 level was 494.1 µg/m3, recorded on 31 December 2019 at the new Goulburn station (commenced on 6 November), due to a combination of smoke from bushfires throughout the day, and a widespread dust storm during the afternoon.

During the previous year in 2018, all stations also recorded days above the PM10 daily standard, however particle levels were lower throughout most of the network. The maximum daily PM10 concentration in 2018 was 274.1 µg/m3, recorded at Bathurst on 15 December 2018 during an extensive dust storm.

Other known causes of elevated PM10 particle levels are agricultural activities (such as stubble burning) at Wagga Wagga North and sea salt spray at Stockton (refer to figure below). In the Hunter Valley, local industrial sources also affect particle levels. More information on the special purpose industry-funded Hunter Valley monitoring networks is found in the Hunter Valley and Stockton tabs on the Focus areas webpage.


Summary of PM10 observations in NSW in 2019 and graph of exceptional events


Note: SW = South West, NW = North West, CC = Central Coast, CT = Central Tablelands, NT = Northern Tablelands, ST = Southern Tablelands.

Annual average values above the standard are shown as shaded bars with the values against applicable sites. Dotted shading shows levels above the annual average of 25 µg/m3.

na Annual average not reported (<75% of data available – PM10 data available at Rouse Hill from 27 May 2019 and Goulburn from 6 November 2019)

# Days above standard are divided into exceptional and non-exceptional events. Exceptional events are those related to bushfires, hazard reduction burns and continental-scale dust storms. These are not counted towards the NEPM goal of ‘no days above the particle standards in a year’.

PM2.5 fine particle pollution

National standards for PM2.5

  • Annual average – 8 micrograms per cubic metre of air (8 µg/m3)
  • Daily average – 25 micrograms per cubic metre of air (25 µg/m3)

Annual average PM2.5 levels

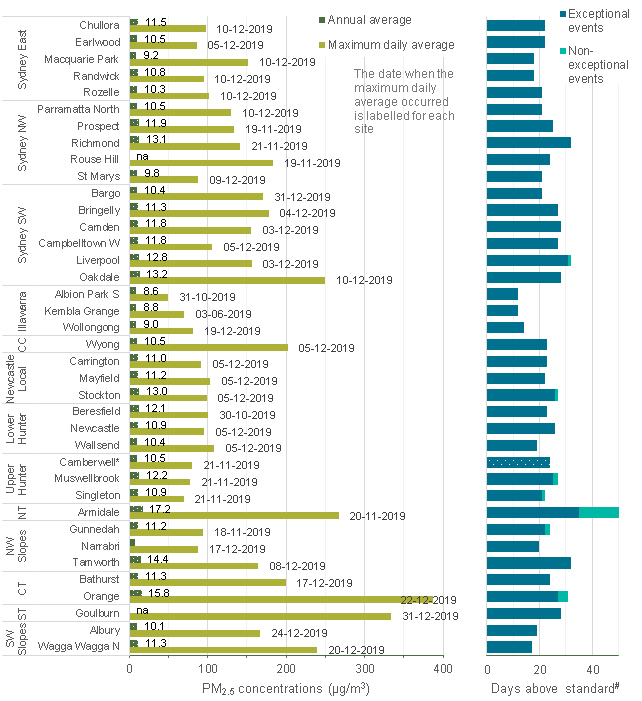
During 2019, 35 of the 36 sites with available annual average data in New South Wales recorded annual average PM2.5 levels above the national standard. PM2.5 annual average levels remained below the standard at Narrabri, in the North-west Slopes region.

Annual average PM2.5 levels ranged from 7.8 µg/m3 at Narrabri in the North-west Slopes to 17.2 µg/m3 at Armidale in the Northern Tablelands during 2019.

There was an increase in annual average PM2.5 concentrations and the number of sites exceeding the annual average standard in 2019, compared with 2018. In 2018, annual average PM2.5 levels ranged from 4.9 µg/m3 at Narrabri in the North-west Slopes region to 10.1 µg/m3 at Liverpool in Sydney South-west, with 16 of 33 sites above the annual average PM2.5 standard. The increase was mainly due to widespread bushfire smoke during the late spring to summer bushfire emergency period and the increase in particles throughout the State due to the continuing intense drought. Hazard reduction burns around Sydney from April to August also contributed to particle levels in 2019.

Daily average PM2.5 levels

Daily PM2.5 levels were over the standard at one or more metropolitan or regional population centres on 118 days in 2019 (compared with 52 days in 2018). All 37 NSW air quality monitoring sites in metropolitan and regional population centres, plus Camberwell, recorded daily PM2.5 levels above the national standard on at least 12 days each in 2019.

The most days above the PM2.5 daily standard were recorded at:

  • Armidale (60 days) – due to bushfire smoke (35 days) and wood smoke from domestic heaters associated with cold calm nights with temperatures close to or below zero degrees (25 days)
  • Liverpool (32 days) – due to bushfire smoke (24 days), hazard reduction burns (7 days) and wood smoke (1 day)
  • Richmond (32 days) – due to bushfire smoke (27 days) and hazard reduction burns (5 days)
  • Tamworth (32 days) – due to bushfire smoke.
  • Orange (31 days) – due to bushfire smoke (25 days), widespread dust storm (1 day), hazard reduction burning (1 day) and wood smoke (4 days).

The maximum daily PM2.5 was 387.4 µg/m3, recorded at Orange on 22 December 2019, due to bushfire smoke. 

In 2019, more stations recorded days above the PM2.5 daily standard and particle levels were higher, compared with 2018. In 2018, 23 stations recorded days above the PM2.5 daily standard and the maximum daily PM2.5 concentration was 123.8 µg/m3, recorded at Richmond on 25 April 2018 due to hazard reduction burns. The increase in 2019 was due to widespread smoke from bushfires burning around 4 million hectares in New South Wales from July to December 2019. Hazard reduction burns affected some days over the standard during the cooler months, however the number and scale of these was comparable to previous years.

Another known cause of elevated PM2.5 particle levels is smoke from domestic wood heaters. For example, the Upper Hunter Fine Particle Characterisation Study found that wood smoke was a major contributor to PM2.5 levels at Muswellbrook and Singleton in winter 2012.

Under the current NSW regulatory regime, wood smoke is managed largely by local government. Local councils have regulatory powers to control installation of wood heaters using their planning instruments. The NSW Environment Protection Authority (EPA) has been overseeing the existing regulatory framework and collaborating with stakeholders to improve wood heater emission and efficiency standards. The EPA has also developed a new suite of educational materials that councils can use to raise public awareness about wood smoke impacts and help wood heater owners to reduce particle pollution from their wood heaters.

Summary of PM2.5 observations in NSW and graph of exceptional events

Note: SW = South West, NW = North West, CC = Central Coast, CT = Central Tablelands, NT = Northern Tablelands, ST = Southern Tablelands.

Annual average values above the standard are shown as shaded bars with the values against applicable sites.

na Annual average not reported (<75% of data available – PM2.5 data available at Rouse Hill from 27 May 2019 and Goulburn from 6 November 2019)

# Days above standard are divided into exceptional and non-exceptional events. Exceptional events are those related to bushfires, hazard reduction burns and continental-scale dust storms. These are not counted towards the NEPM goal of ‘no days above the particle standards in a year’.

*Camberwell is an Upper Hunter Air Quality Monitoring Network small community monitoring station which is not suitable for assessing performance against NEPM standards, and therefore, events are not reported as exceptional or non-exceptional (see the Hunter Valley tab of the Focus areas webpage).