Annual average PM10 levels in 2022 were the lowest recorded at most New South Wales metropolitan and regional population centres since records began at each station. Many stations recorded annual average levels of PM10 less than half of the standard.
Daily average PM10 levels in 2022 were within the national standard at NSW metropolitan and regional population centres on 99% of days, excluding Stockton (90% of days including Stockton). Only 3 stations recorded 1 or more days with levels exceeding the standards.
This is an improvement compared to 2021, which recorded PM10 levels within the standard on 95% of days excluding Stockton (90% of days including Stockton).
National standards for PM10
- Annual average – 25 micrograms per cubic metre of air (25 µg/m3)
- Daily average – 50 micrograms per cubic metre of air (50 µg/m3).
Annual average PM10 levels
Annual average PM10 levels in 2022 were the lowest recorded at 42 of the 43 metropolitan and regional population centre monitoring stations, with available annual average data since records began at each station, with some dating back to 1994. The exception was Stockton in the Newcastle local region.
Annual average PM10 levels were within the national standard at all but one station in 2022. The exception was Stockton in the Newcastle local region, which recorded an annual average of 30.3 µg/m3. This is similar to 2021, when only Stockton recorded an annual average PM10 over the national standard, with a level of 30.1 µg/m3.
The Stockton monitoring station is significantly affected by sea salt, which means exceeding the annual average PM10 standard is common at this location. More information on the elevated levels recorded at Stockton can be found in the Stockton page of the Focus areas.
Apart from Stockton, annual average levels in New South Wales in 2022 ranged from 6.7 µg/m3 at Narrabri in the North West Slopes to 19.3 µg/m3 at Carrington in the Newcastle local region. In 2021, annual average levels excluding Stockton ranged from 7.0 µg/m3 at Narrabri in the North West Slopes to 21.0 µg/m3 at Carrington.
More information about particle levels in the Hunter regions can be found in Focus areas – on the Hunter Valley and Stockton pages.
Daily average PM10 levels
Daily average PM10 levels exceeded the national standards at one or more of the 44 stations in metropolitan or regional population centres on 2 days in 2022, excluding Stockton. This is significantly lower than 2021, when there were 18 days over the standard.
When including Stockton, there were 38 days over the daily PM10 standard, compared with 40 days in 2021.
In 2022, 3 of the 44 monitoring stations recorded daily average PM10 levels over the national standards (see PM10 daily and annual summary graph). These were recorded at Mayfield and Stockton in the Newcastle local network, and Armidale in the Northern Tablelands.
In 2021, 18 monitoring stations recorded daily average PM10 levels over the national standards, with 15 in the Sydney Greater Metropolitan Region (ranging from the Illawarra to Newcastle), 1 in the Upper Hunter and 2 in the Riverina-Murray region.
The maximum daily average PM10 level in 2022 was 95.9 µg/m3, recorded at Stockton in the Newcastle local network on 17 January 2022, and was due to sea salt spray.
At Stockton, sea salt spray results in elevated PM10 levels. Local industrial sources also affect particle levels throughout the Hunter Valley. More information on the industry-funded Hunter Valley monitoring networks is found on the Hunter Valley and Stockton pages in the Focus areas.
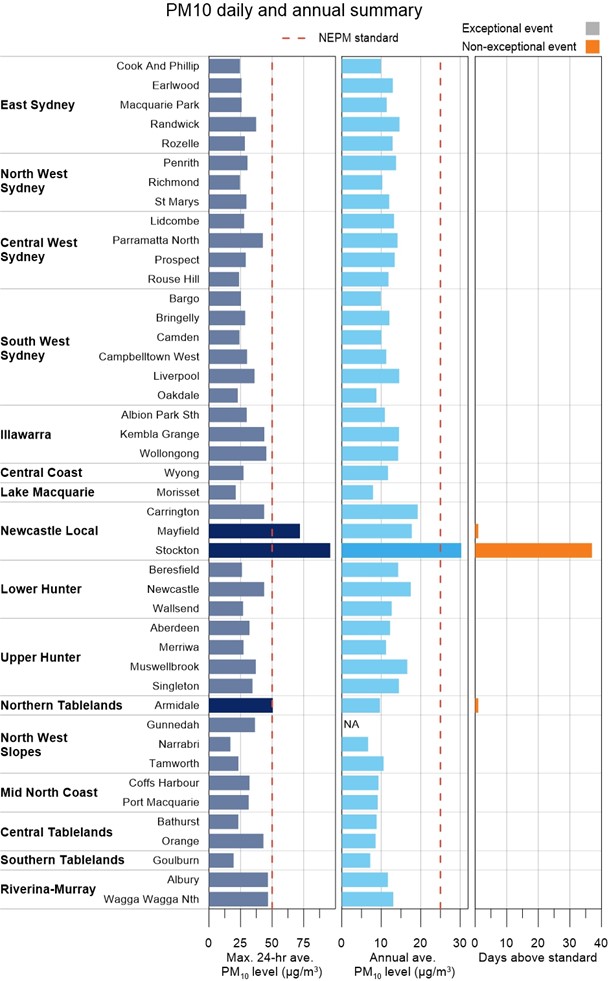
PM10 daily and annual summary
Bar chart summary of PM10 measurements at the 44 stations in NSW metropolitan or regional population centres. It shows, for PM10, the maximum daily average, annual average and exceptional and non-exceptional event days. Exceedances of the daily and annual standards are shaded darker.
NA Annual average not reported (<75% of data available – PM10 data not available at Gunnedah from 26 July to 27 October 2022 due to an instrument fault).
Note: Days exceeding standard are divided into exceptional and non-exceptional events. Exceptional events are those related to bushfires, hazard reduction burns and continental-scale dust storms. These are not counted towards the National Environment Protection (Ambient Air Quality) Measure (NEPM) goal of 'no days above [that is, exceeding] the particle standards in a year'.