When: Study undertaken in 2015 and 2016 based on the analysis of sampling data collected over the 1 January 2000 to 31 December 2014 period
Where: Greater Sydney
Aims: to investigate the composition and major sources of fine particle pollution in Greater Sydney, and how the contribution of sources changed over the 2000–14 period
Findings: Wood smoke, industry, vehicles, sea salt and soil contribute to fine particle concentrations in Sydney’s air. Smoke, including from domestic wood burning, was a significant source of fine particle pollution in the winter at western Sydney sites. Secondary sulfate contributed significantly to fine particles in the summer, with emissions from coal-fired power stations and industry contributing to such particles. Particles from motor vehicles remain a significant source of fine particle pollution.
Health impacts of fine particles: Fine particles can pass through the throat and nose and into the lungs, causing respiratory and cardiovascular problems.
What is the 15-year Sydney Particle Characterisation Study?
The 15-year Sydney Particle Characterisation Study aimed to improve our understanding of the sources of air particle pollution in Sydney, and how the contribution of sources changed over the 2000–14 period. It focussed on very fine particles (PM2.5), invisible to the human eye, which can be inhaled and pass through the throat and nose into the lungs.
The Australian Nuclear Science and Technology Organisation (ANSTO) was commissioned to carry out the study by the NSW Environment Protection Authority (EPA) in collaboration with the former Office of Environment and Heritage. The study involved analysis of existing PM2.5 datasets for 4 Sydney sampling sites. Positive Matrix Factorisation (PMF) source apportionment was undertaken based on samples collected at Lucas Heights, Richmond, Mascot and Liverpool over a 15-year period (2000–14).
Source factors were identified based on the types and ratios of chemicals that occur together. Source factors may come from one source (for example, sea salt) or may be a mixture of sources (for example, mixed-smoke-auto).
The full study is detailed in the study report, and the study database (XLSM 9.8MB) and associated database manual is also available.
What were the aims of the study?
The study aimed to identify and quantify the major contributors of fine particle pollution in the Sydney basin, and how contributions have changed over time. This involved:
- identifying and quantifying source factors contributing to PM2.5 concentrations based on the analysis of an existing 15-year PM2.5 mass and elemental dataset available for four sites in the Sydney basin
- characterising seasonal and annual variations in the contribution of source factors to PM2.5 concentrations over the 2000–14 period for each of the 4 sites.
What did the study find?
The Sydney Particle Characterisation Study key findings are:
- Sydney’s air contains fine particles from wood smoke, industry, vehicles, sea salt and soil.
- Smoke, including from domestic wood burning, contributed 60% to 80% of fine particles at some sites in the winter months.
- Secondary sulfates, due to emissions from coal-fired power stations and industry, contributed 50% to 70% of fine particles in summer at some sites.
- Particles from automobiles declined by 40% over the 15 years, but motor vehicles remain a significant source of fine particle pollution.
The table below shows how PM2.5 sources were categorised and the contributions from each source. Around 85% of the PM2.5 mass across the 4 sampling sites is from human sources. The 2 automobile factors together contributed 1.45 μg/m³ or around 23% of the total PM2.5. Secondary sulfates contributed around a further 24% to the total PM2.5. Natural emissions such as sea salt and dust also contributed to PM2.5 concentrations.
Smoke from biomass burning, particularly domestic wood heaters in the winter months with components of smoke from light, medium and heavy diesel vehicles, particularly at Mascot.
| Description | Major sources | 15-year average PM2.5 mass | % of total PM2.5 mass |
|---|---|---|---|
| Soil | Fine wind-blown dust | 0.245 µg/m³ | 4 ± 5% |
| Sea | Sea spray transported from the coast across the sampling sites | 0.507 µg/m³ | 10 ± 11% |
| Mixed – secondary sulfate | Secondary sulfates from coal fired power stations, oil refineries, motor vehicles and industry. | 1.63 µg/m³ | 24 ±16% |
| Mixed-industry – aged secondary sulfate | Industrial sources with components of aged secondary sulfates and sea spray | 0.945 µg/m³ | 15 ± 13% |
| Mixed – Smoke auto | Smoke from biomass burning, particularly domestic wood heaters in winter, with components of smoke from light, medium and heavy diesel vehicles, particularly at Mascot. | 2.08 µg/m³ | 24 ± 20% |
| Auto1 | Primary automobile source | 1.22 µg/m³ | 20 ± 10% |
| Auto2 | A second minor automobile source, associated with the use of leaded petrol which ceased early in the study in 2001. | 0.234 µg/m³ | 3 ± 2% |
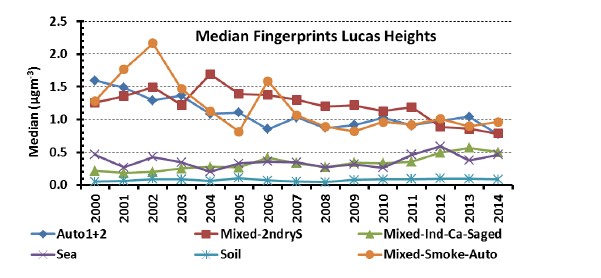
Results indicate that the composition of fine particles varies seasonally. 'Mixed – secondary sulfate' and 'Mixed-Industry-aged sulfate' contributed 50% to 70% of PM2.5 at some sites in the summer months, while the 'Mixed-Smoke-Auto', largely from domestic wood combustion, contributed 60% to 80% at some sites in the winter months. Over the 15-year period, PM2.5 emissions from automobiles, industry and smoke have declined. This decrease in emissions is evident in the source factor contribution trends, as illustrated below for the Lucas Heights site.
How will the results of this study be used?
The study expands the evidence base available to the EPA for assessing the effectiveness of past policy interventions and will inform the development of new policies and programs to further improve Sydney’s air quality.
Data from the study are being used by the department to validate regional particle models which will provide more evidence to support NSW air policy in future years.