The Stockton air quality monitoring station is part of the industry-funded Newcastle Local Air Quality Monitoring Network, focused around the Port of Newcastle. The station is approximately 300 metres from the ocean and 20 metres from Hunter River. Due to its proximity to the coast, high PM10 particle levels recorded at Stockton most often occur under onshore north-easterly winds. The Lower Hunter Particle Characterisation Study found that the largest contribution to PM10 at Stockton was sea salt.
Due to the proximity of industrial sources, compliance reporting against the national ambient air quality standards is not applied at these monitoring stations. However, the government recognises the community's interest in knowing how air pollution levels at these stations compare against these standards. Therefore, this section refers to national standards as national benchmarks when evaluating air quality data at Stockton.
Daily PM10 particle levels at Stockton were over the national benchmark of 50 µg/m3 on 24 days (compared with 55 days in 2020). Stockton typically records the most days exceeding the PM10 benchmark across the NSW air quality monitoring network, due to the station's exposure to sea salt in onshore winds.
The PM10 annual average reached 30.1 µg/m3 (compared to 34.5 µg/m3 in 2020), the highest in New South Wales and the only annual record exceeding the national benchmark of 25 µg/m3 in 2021.
Most of the 24 days exceeding the PM10 benchmark at Stockton (19 days, 79% of the annual total) occurred in the warmer months of January to March and October to December, when onshore winds typically prevail and sea salt contribution increases.
There were no daily PM2.5 particle levels at Stockton over the national benchmark of 25 µg/m3 in 2021. However, Stockton was the only site in New South Wales to record an annual average PM2.5 level which exceeded the benchmark of 8 µg/m3, reaching 8.3 µg/m3 (compared to 9.3 µg/m3 in 2020).
Attributed causes of days above PM10 and PM2.5 benchmarks at Stockton in 2021
| Main Source | PM10 | PM2.5 |
|---|---|---|
| Sea salt | 19 | 0 |
| Bushfire | 1 | 0 |
| Regional dust | 0 | 0 |
| Local dust | 0 | 0 |
| Industry | 3 | 0 |
| Hazard reduction burning | 0 | 0 |
| Woodsmoke | 0 | 0 |
| Agricultural burning | 0 | 0 |
| Widespread dust storm | 1 | 0 |
Sea salt was found to be the main contributor to the levels on 19 days of the 24 days exceeding the daily PM10 benchmark at Stockton in 2021 (Refer to Table: Attributed causes of days above PM10 and PM2.5 benchmarks at Stockton in 2021). High PM10 levels from sea salt is primarily recorded during north-easterly to south-easterly winds, when the monitor is downwind of the coast (Refer to Figure: PM10, PM2.5 and NH3 polar plots of 1-hour average Stockton data in 2021).
A polar plot is one method that can be used to show how wind can impact on pollutant concentrations at a monitoring station. These show what the average concentration of pollutant such as PM2.5 is, for a given wind direction and wind speed. Higher average concentrations are shown in red colours, whereas lower concentrations are shown in blue.
The Stockton PM2.5 polar plot indicates higher than average PM2.5 levels originate from the north-west during moderate wind speed conditions. The Lower Hunter Particle Characterisation Study found that local industrial sources contribute the PM2.5 levels recorded at Stockton in winter, under north-west winds. These levels are influenced mainly by direct emissions of ammonium nitrate particles from industry, located approximately one kilometre to the north-west, on Kooragang Island. A similar signature of higher ammonia (NH3) levels under moderate north-westerly winds can be seen in the NH3 polar plot for Stockton, indicating a common source for PM2.5 and NH3 under these conditions.
Hourly ammonia levels were below the assessment goal of 46 pphm at Stockton throughout 2021. The maximum hourly NH3 level was 35.8 pphm (compared to 30.3 pphm in 2020), recorded on 21 May 2021. The annual average ammonia level was 1.4 pphm (compared to 1.4 pphm in 2020).
For PM10, the highest concentrations are observed under all north-easterly winds indicating the impact of the Stockton beach and sea salt on PM10 measurements. Additionally, high PM10 concentrations are also observed when the wind is strong and from the east, south and north-west. This is indicated by darker shades of red further away from the station in the middle of the graph in those compass directions, when the wind speed is greater than 8 metres per second. These are caused by sea salt when arriving from the east or south, and transported dust when arriving from the north-west.
For more information on seasonal air quality at Stockton, refer to the Newcastle seasonal newsletters.
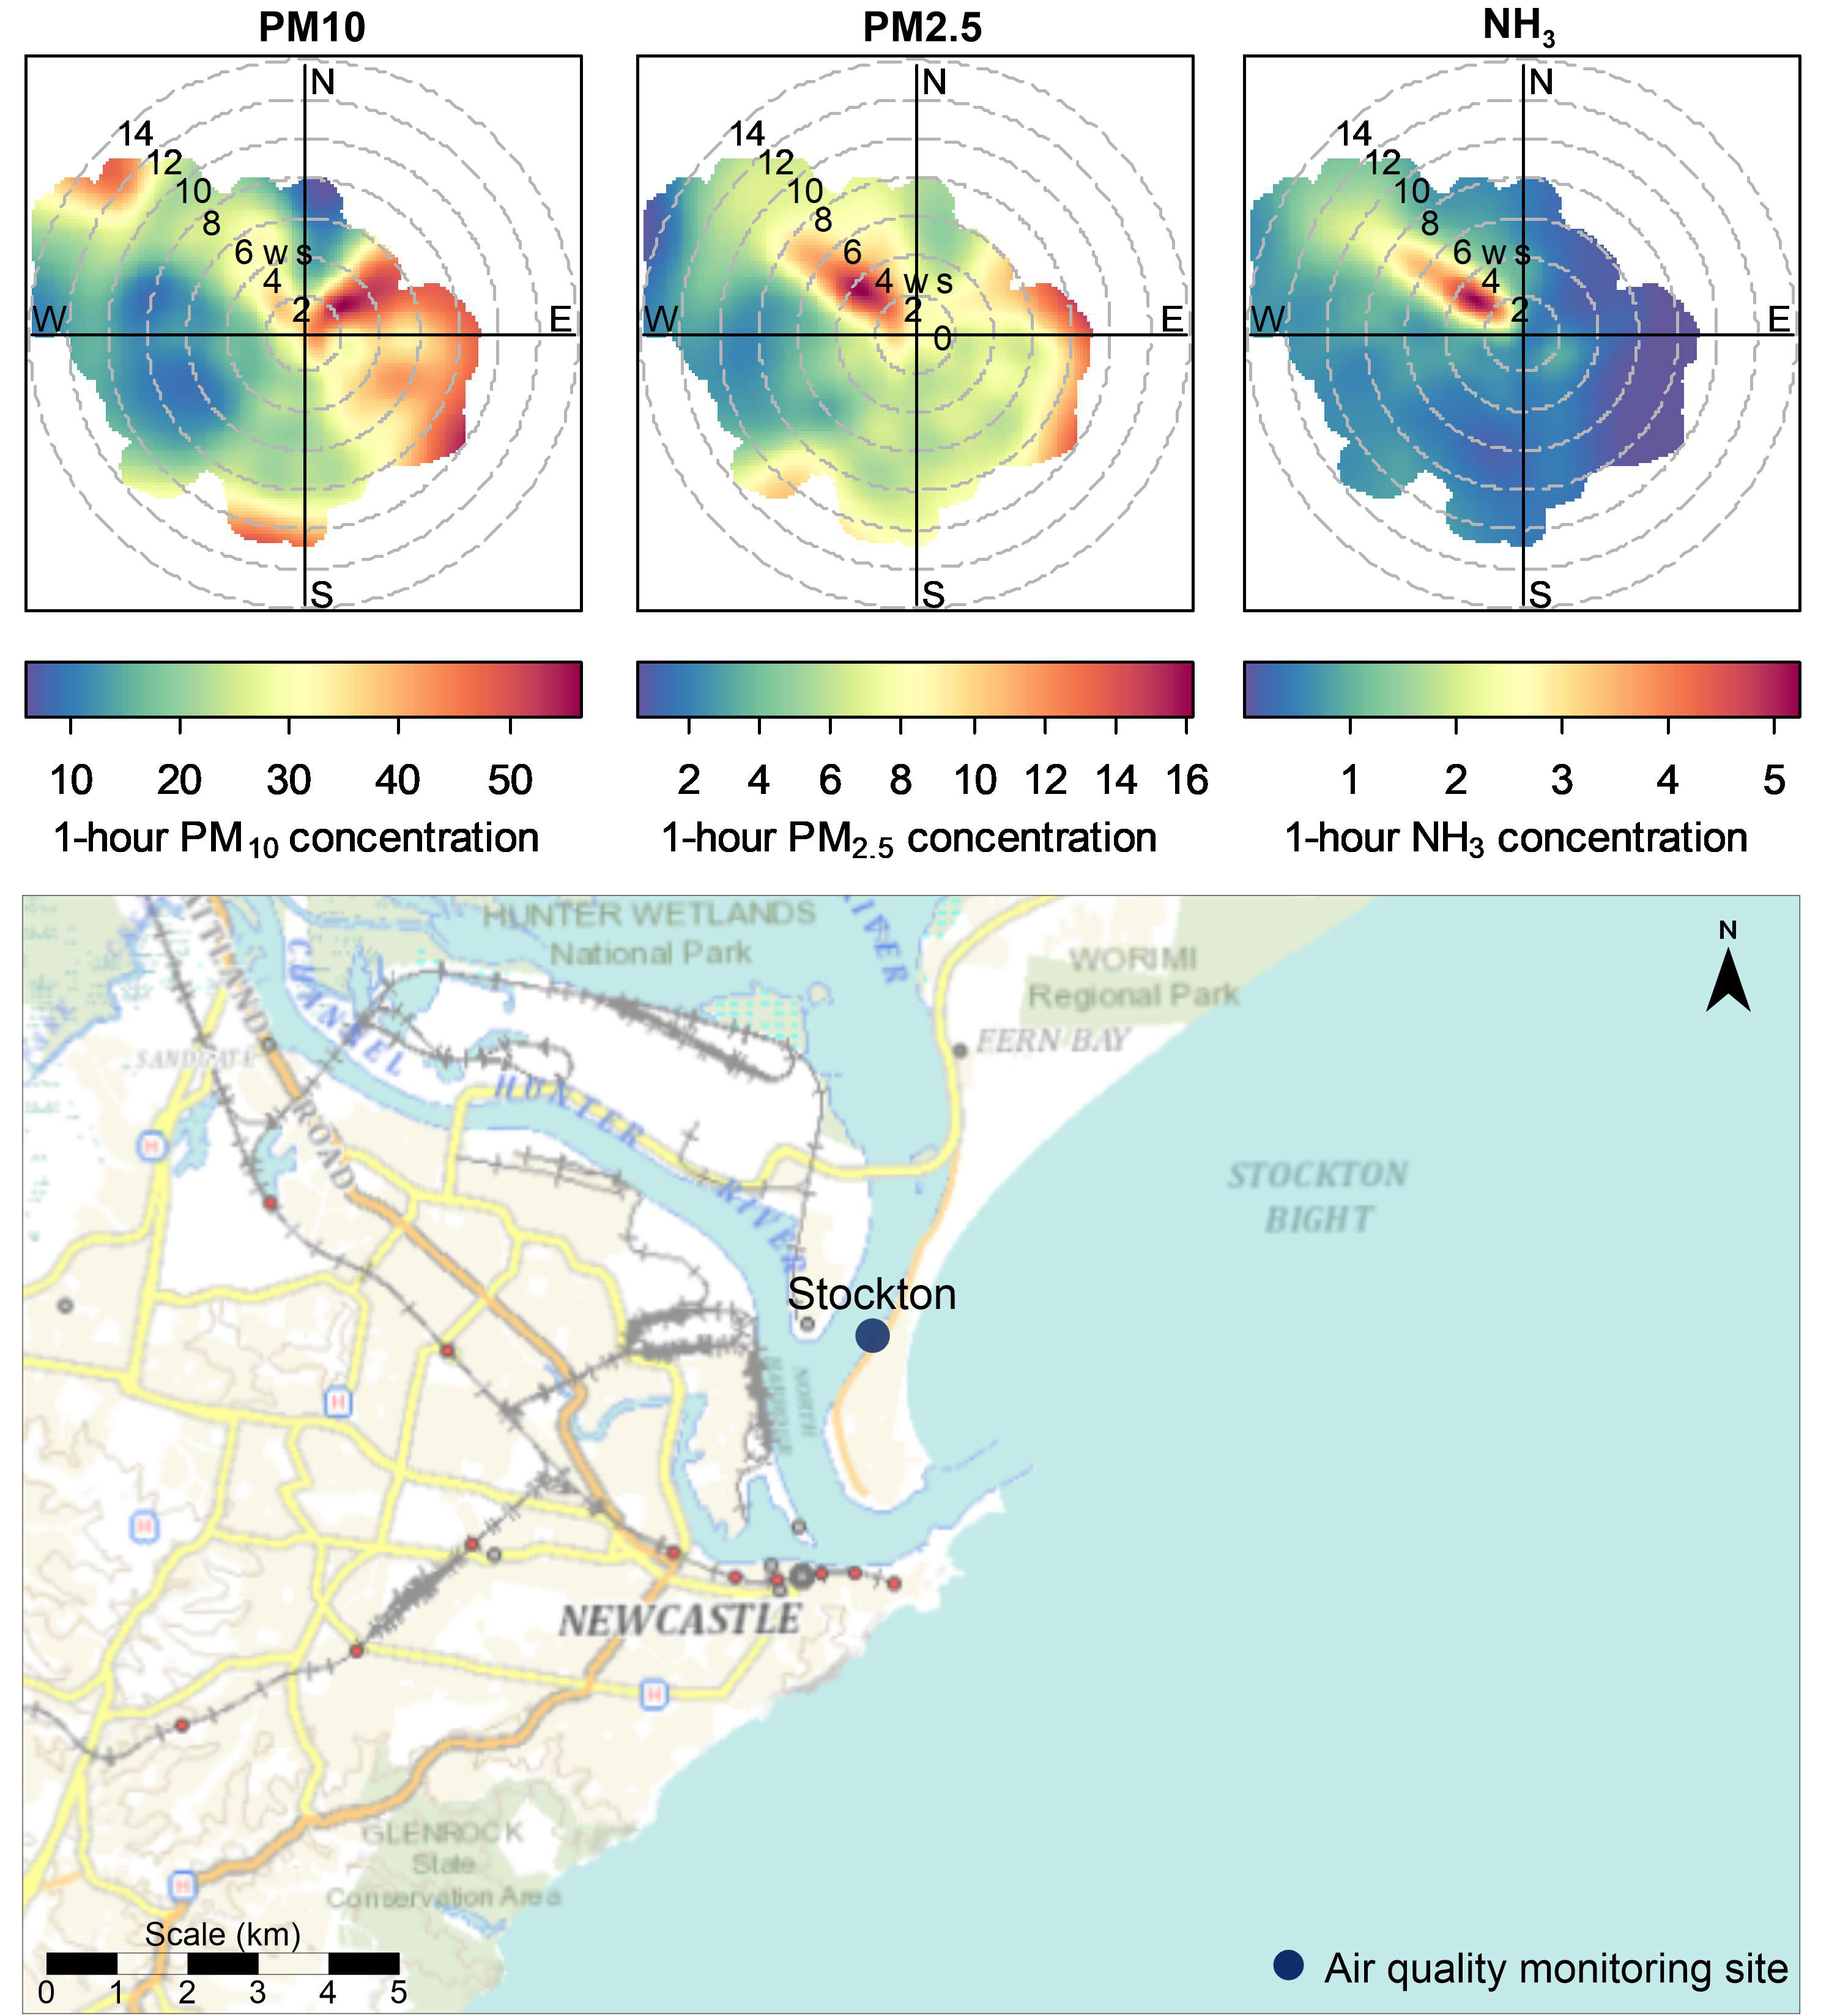
Polar plots of hourly PM10, PM2.5 and ammonia (NH3) for 2021 at Stockton
Polar plots show what the average concentration of pollutant, such as PM2.5 is, for a given wind direction and wind speed. Higher average concentrations are shown in red colours whereas lower concentrations are shown in blue.
Note: Polar plots indicate how average pollutant concentrations vary in different wind speed and direction conditions. Pollutant concentrations are shown as a smoothed surface and are colour graded relative to the data limits (not against any standards or criteria) in order to highlight conditions in which higher pollutant levels occur.