We conduct a population-wide visitor survey every 2 years to gather information from Australian residents about their use of NSW national parks.
Information is collected on how many, and which parks survey participants visit, the activities and experiences they undertake, their levels of satisfaction and so on.
The survey helps us with park management and planning for visitor facilities.
Survey results are summarised below.
Domestic visitation trends
Visitation to national parks in New South Wales has grown by 49% over the past 10 years, reaching more than 53 million visits in 2022. This was achieved despite the state experiencing its second-wettest year on record since 1900.
| Park visitation by year | Adult visitation | Child visitation | Total visitation |
|---|---|---|---|
| 2008 | 31,128,875 | 6,798,741 | 37,927,616 |
| 2010 | 27,262,279 | 6,581,347 | 33,843,626 |
| 2012 | 28,745,337 | 6,750,287 | 35,495,624 |
| 2014 | 31,674,661 | 7,761,387 | 39,436,048 |
| 2016 | 40,103,897 | 11,558,047 | 51,661,944 |
| 2018 | 45,333,817 | 14,902,193 | 60,236,009 |
| 2020 | 38,541,509 | 11,543,729 | 50,085,238 |
| 2022 | 40,499,303 | 12,506,400 | 53,163,728 |
Factors influencing visitation
Visitation in 2020 and 2022 was impacted by major widespread disruptions, including natural disasters and the COVID-19 pandemic.
2019–20 bushfires
The 2019–20 bushfires were unprecedented in their extent and intensity, with more than 37% of the NSW national park system impacted. Many parks were closed or had restricted access from December 2019 through to March 2020, with 257 visitor precincts being closed. Severely bushfire-damaged precincts were closed for longer periods while repair works were completed.
COVID-19 pandemic
The COVID-19 pandemic and its associated travel and border restrictions impacted access to NSW national parks from March to December 2020. The National Parks and Wildlife Service (NPWS) was required to close or restrict park access as part of the government’s coordinated response to the pandemic. For example, national park campgrounds, accommodation, visitor centres, tours and events were closed. At times, NSW residents were restricted to travelling only 5 km from their home, and interstate and international visitation was curtailed.
Eastern Australia floods
The 2022 eastern Australian floods were one of the nation’s worst-recorded flood disasters. New South Wales averaged annual rainfall of 863.6 mm, which was 55% above the 1961–1990 average and the second-highest on record. Flooding occurred from the Northern Rivers to the Illawarra coast.
It was the wettest July on record for the Central Coast and a very wet August across the state. Spring was the wettest on record and the coolest since 1992. While NSW national park visitation was high in early summer, visitation was below the norm for the rest of 2022, indicating that significant and prolonged rain events did impact park visitation.
Most visited parks
| Park | 2020 visits | 2022 visits |
|---|---|---|
| Blue Mountains | 6,173,567 | 6,406,246 |
| Royal | 5,307,483 | 5,059,903 |
| Ku-ring-gai Chase | 3,099,270 | 4,404,512 |
| Lane Cove | 2,759,428 | 2,615,028 |
| Sydney Harbour | 2,209,916 | 1,930,415 |
| Kamay Botany | 1,794,002 | 907,974 |
| Kosciuszko | 1,466,986 | 2,489,307 |
| Garigal | 428,088 | 1,184,537 |
Where visitors come from
Intrastate visitation comprised 87% of all visits, with 13% of visits from interstate, including 4% from Melbourne.
| Park visitation estimate 2022 | Adult visits (Number) | Adult visits (%) | Child visits (Number) | Child visits (%) | Total visits (Number) | Total visits (%) |
|---|---|---|---|---|---|---|
| Sydney | 22,903,294 | 56.55% | 6,920,365 | 55.33% | 29,823,659 | 56.26% |
| Remainder NSW | 12,764,396 | 31.52% | 3,422,400 | 27.37% | 16,186,796 | 30.54% |
| ACT | 524,186 | 1.29% | 211,812 | 1.69% | 735,998 | 1.39% |
| Melbourne | 1,641,164 | 4.05% | 952,865 | 7.62% | 2,594,030 | 4.89% |
| Remainder VIC | 635,532 | 1.57% | 178,682 | 1.43% | 814,214 | 1.54% |
| Brisbane | 780,022 | 1.93% | 268,931 | 2.15% | 1,048,952 | 1.98% |
| Remainder South East QLD | 387,084 | 0.96% | 122,111 | 0.98% | 509,194 | 0.96% |
| Remainder QLD | 249,846 | 0.62% | 124,177 | 0.99% | 374,022 | 0.71% |
| SA | 218,215 | 0.54% | 108,456 | 0.87% | 326,671 | 0.62% |
| WA | 155,112 | 0.38% | 77,093 | 0.62% | 232,205 | 0.44% |
| TAS | 100,118 | 0.25% | 49,760 | 0.40% | 149,877 | 0.28% |
| NT | 140,336 | 0.35% | 69,749 | 0.56% | 210,085 | 0.40% |
| Total Australia 2022 | 40,499,304 | 100.00% | 12,506,399 | 100.00% | 53,005,703 | 100.00% |
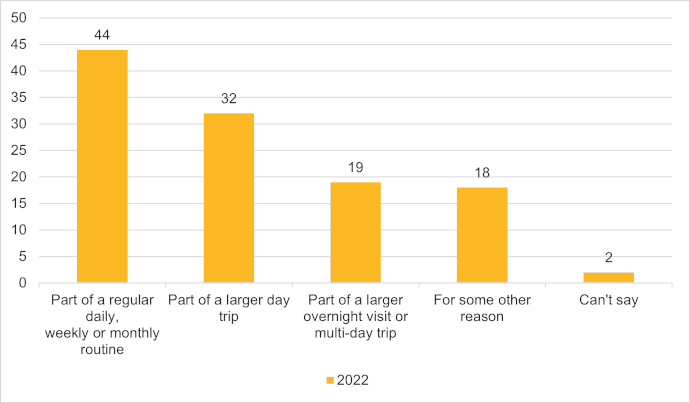
Types of trips
Over 40% of visits to our parks are part of a regular routine, 32% are day trips and 19% are part of an overnight or multi-day trip.
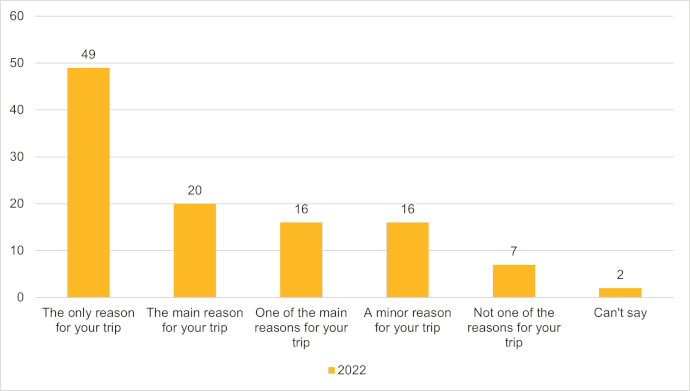
Tourism generation
Just over 49% of NSW national park visitors indicated that the only reason for their trip was to visit the park. Another 20% of visitors indicated that the park was the main reason for their trip.
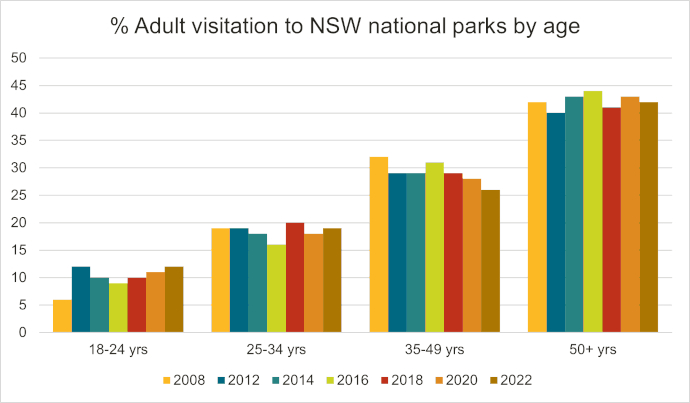
Age of visitors
This chart shows the demographic spread of adult visitors to NSW national parks in survey years.
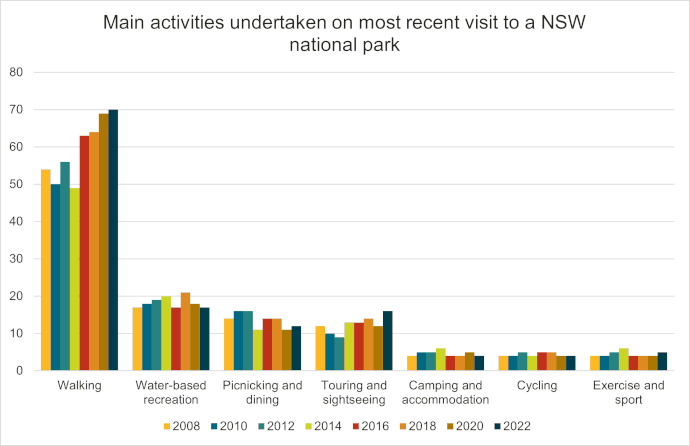
What visitors do
Walking was consistently the most common activity undertaken in parks, with 70% of visitors listing it as their main activity. This had increased slightly from 68% in 2020.
Other activities undertaken by park visitors included:
- water-based recreation at 17%
- touring and sight-seeing at 16%
- picnicking or dining at 12%.
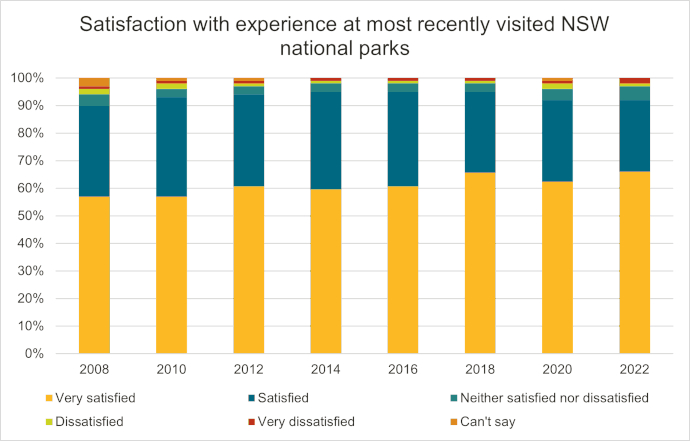
Visitor satisfaction
The proportion of visitors very satisfied with their park experience in 2022 was the highest recorded, with 66% of visitors very satisfied, which is 3% higher than in 2020.
Data sources
2022 survey
The NSW National Parks and Wildlife Service (NPWS) used a random representative population-based telephone survey to collect this data.
More than 1,200 people were interviewed in 13 waves every 4 weeks from 4 January to 13 December 2022, with the overall sample size after wave 13 being 15,623 people.
Respondents from New South Wales, Victoria, Queensland and the Australian Capital Territory were surveyed about NSW national parks they had visited within the last 4 weeks. Visits from the rest of Australia were estimated. This methodology has been used since 2008.
For more information on the 2022 survey, read Annual Visits to NSW NPWS Managed Parks in New South Wales 2022 (PDF 3.41MB).
2020 survey
Annual Visits to NSW NPWS Managed Parks in New South Wales 2020 (PDF 3MB).
2018 survey
Annual Visits to NSW NPWS Managed Parks in New South Wales 2018 (PDF 2.7MB).
The study was based on a survey method developed by Parks Victoria. The department wishes to acknowledge the generosity of Parks Victoria in sharing their experiences and the method.