Human waste, pollution, sediments and plastics in urban areas are often discharged from rivers into the ocean along our coast. Even estuaries in pristine areas release carbon and nutrients into the coastal zone.
Ocean monitoring helps us keep track of changes in the coastal environment and support healthy coastal communities, ecosystems and businesses.
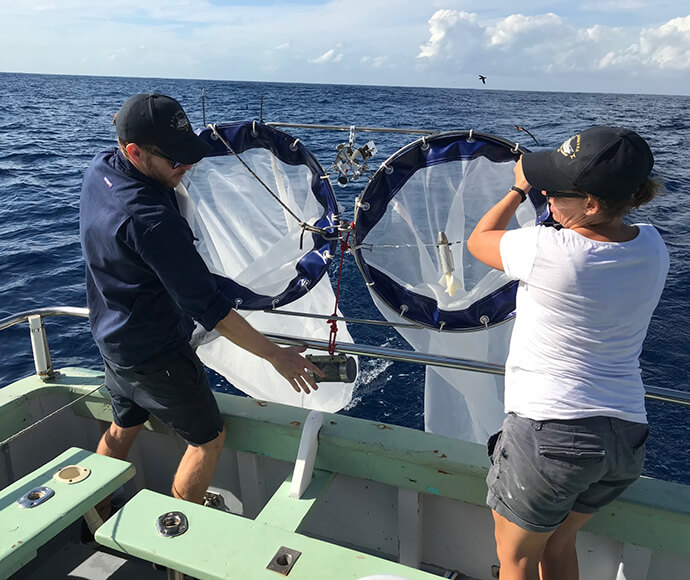
Sample collection
We sample ocean water and sediments over the NSW continental shelf using conductivity-temperature-depth profilers, closing-bottle samplers, sediment grabs/corers and specialised plankton nets. These samples help us:
- understand the amount and distribution of nutrients and pollution associated with events such as floods
- monitor change by repeating sampling over time
- understand how organisms at the base of the food chain, such as microscopic phytoplankton, zooplankton and larval fish, change in response to season, climate and human-induced pressures.
We also measure some parameters remotely, such as sediment in water, by analysing images from satellites.
We collect samples at the ocean surface on our research vessel RV Bombora to measure water temperature, salinity, currents, chlorophyll content and coloured dissolved organic matter.
This information is used to:
- track changes in water quality
- map marine productivity
- understand impacts of coastal river outflows on our coastal habitats
- track dispersal of pollutants
- validate temperature, chlorophyll and turbidity measured by satellites.
We also sample water and measure pH, dissolved oxygen, turbidity, salinity, temperature, nutrients and plankton up to 200 metres below the surface using a carousel of water bottles.
With a ‘live feed’ to the surface, we can read the information in real-time and close the bottles off at any depth.
The water column has been monitored at the Port Hacking National Reference Station (NRS) since 1945.
We have managed monthly sampling off Cronulla since 1997 using our research vessel RV Bombora, or charter vessels in collaboration with universities and the Sydney Institute of Marine Science.
The work measures essential ocean and biological variables such as:
- temperature
- salinity
- dissolved oxygen, dissolved carbon, alkalinity
- nutrients (nitrogen, phosphorus, silica)
- fluorescence (chlorophyll-a, turbidity, dissolved organic matter)
- plankton and bacteria
- microplastics.
This work is mainly funded by the national Integrated Marine Observing System and data is publicly available on the Australian Oceanographic Data Network website.
Monitoring ocean change
There is a network of 7 NRS sites in Australia and they use the Global Ocean Observing System to collect information on essential ocean and biological variables.
These long-term datasets tell us that:
- the ocean off Sydney is warming
- southern NSW waters have warmed more quickly than those in the north.
For more information on ocean warming go to the NSW State of the Environment Report 2021.
For analysis of national trends in many of the key variables go to the 2020 State and Trends of Australia’s Oceans report.
We collaborate with the CSIRO to understand how much of the NSW continental shelf is impacted upon by large rainfall events.
Rivers such as the Hawkesbury (Sydney), Hunter (Newcastle) and Clarence (north coast) discharge large volumes of water laden with sediment to the coast. After rain events or floods, this water forms plumes that can stretch 30–50 kilometres out to sea. Once offshore the plumes are affected by the southerly flow of the East Australian Current and its swirling eddies.
Funded by the NSW Marine Estate Management Authority, we’re looking at 20-plus years of ocean satellite imagery to understand these plumes and the potential impact they have. To do this we need powerful computers to process the extraordinarily large volumes of data: for every 1 square kilometre of ocean surface across the continental shelf thousands of ‘data points’ may be generated.
CSIRO have created a metaphorical cube of data, or data cube, for the 20-plus years of data and use cloud processing with specialised ‘ocean optics’ algorithms to crunch the numbers. The results will tell us what has been happening along the entire coast over the last 20 years.
New satellite data could then be used by coastal managers to:
- develop ocean water quality guidelines
- monitor and manage their section of coast
- feed information into models that predict future changes.
Read more on the Marine Estate Management Authority’s mapping outflow events webpage.