There were 47 days where air quality did not meet national standards at one or more stations, compared with 19 days in 2022.
Overview
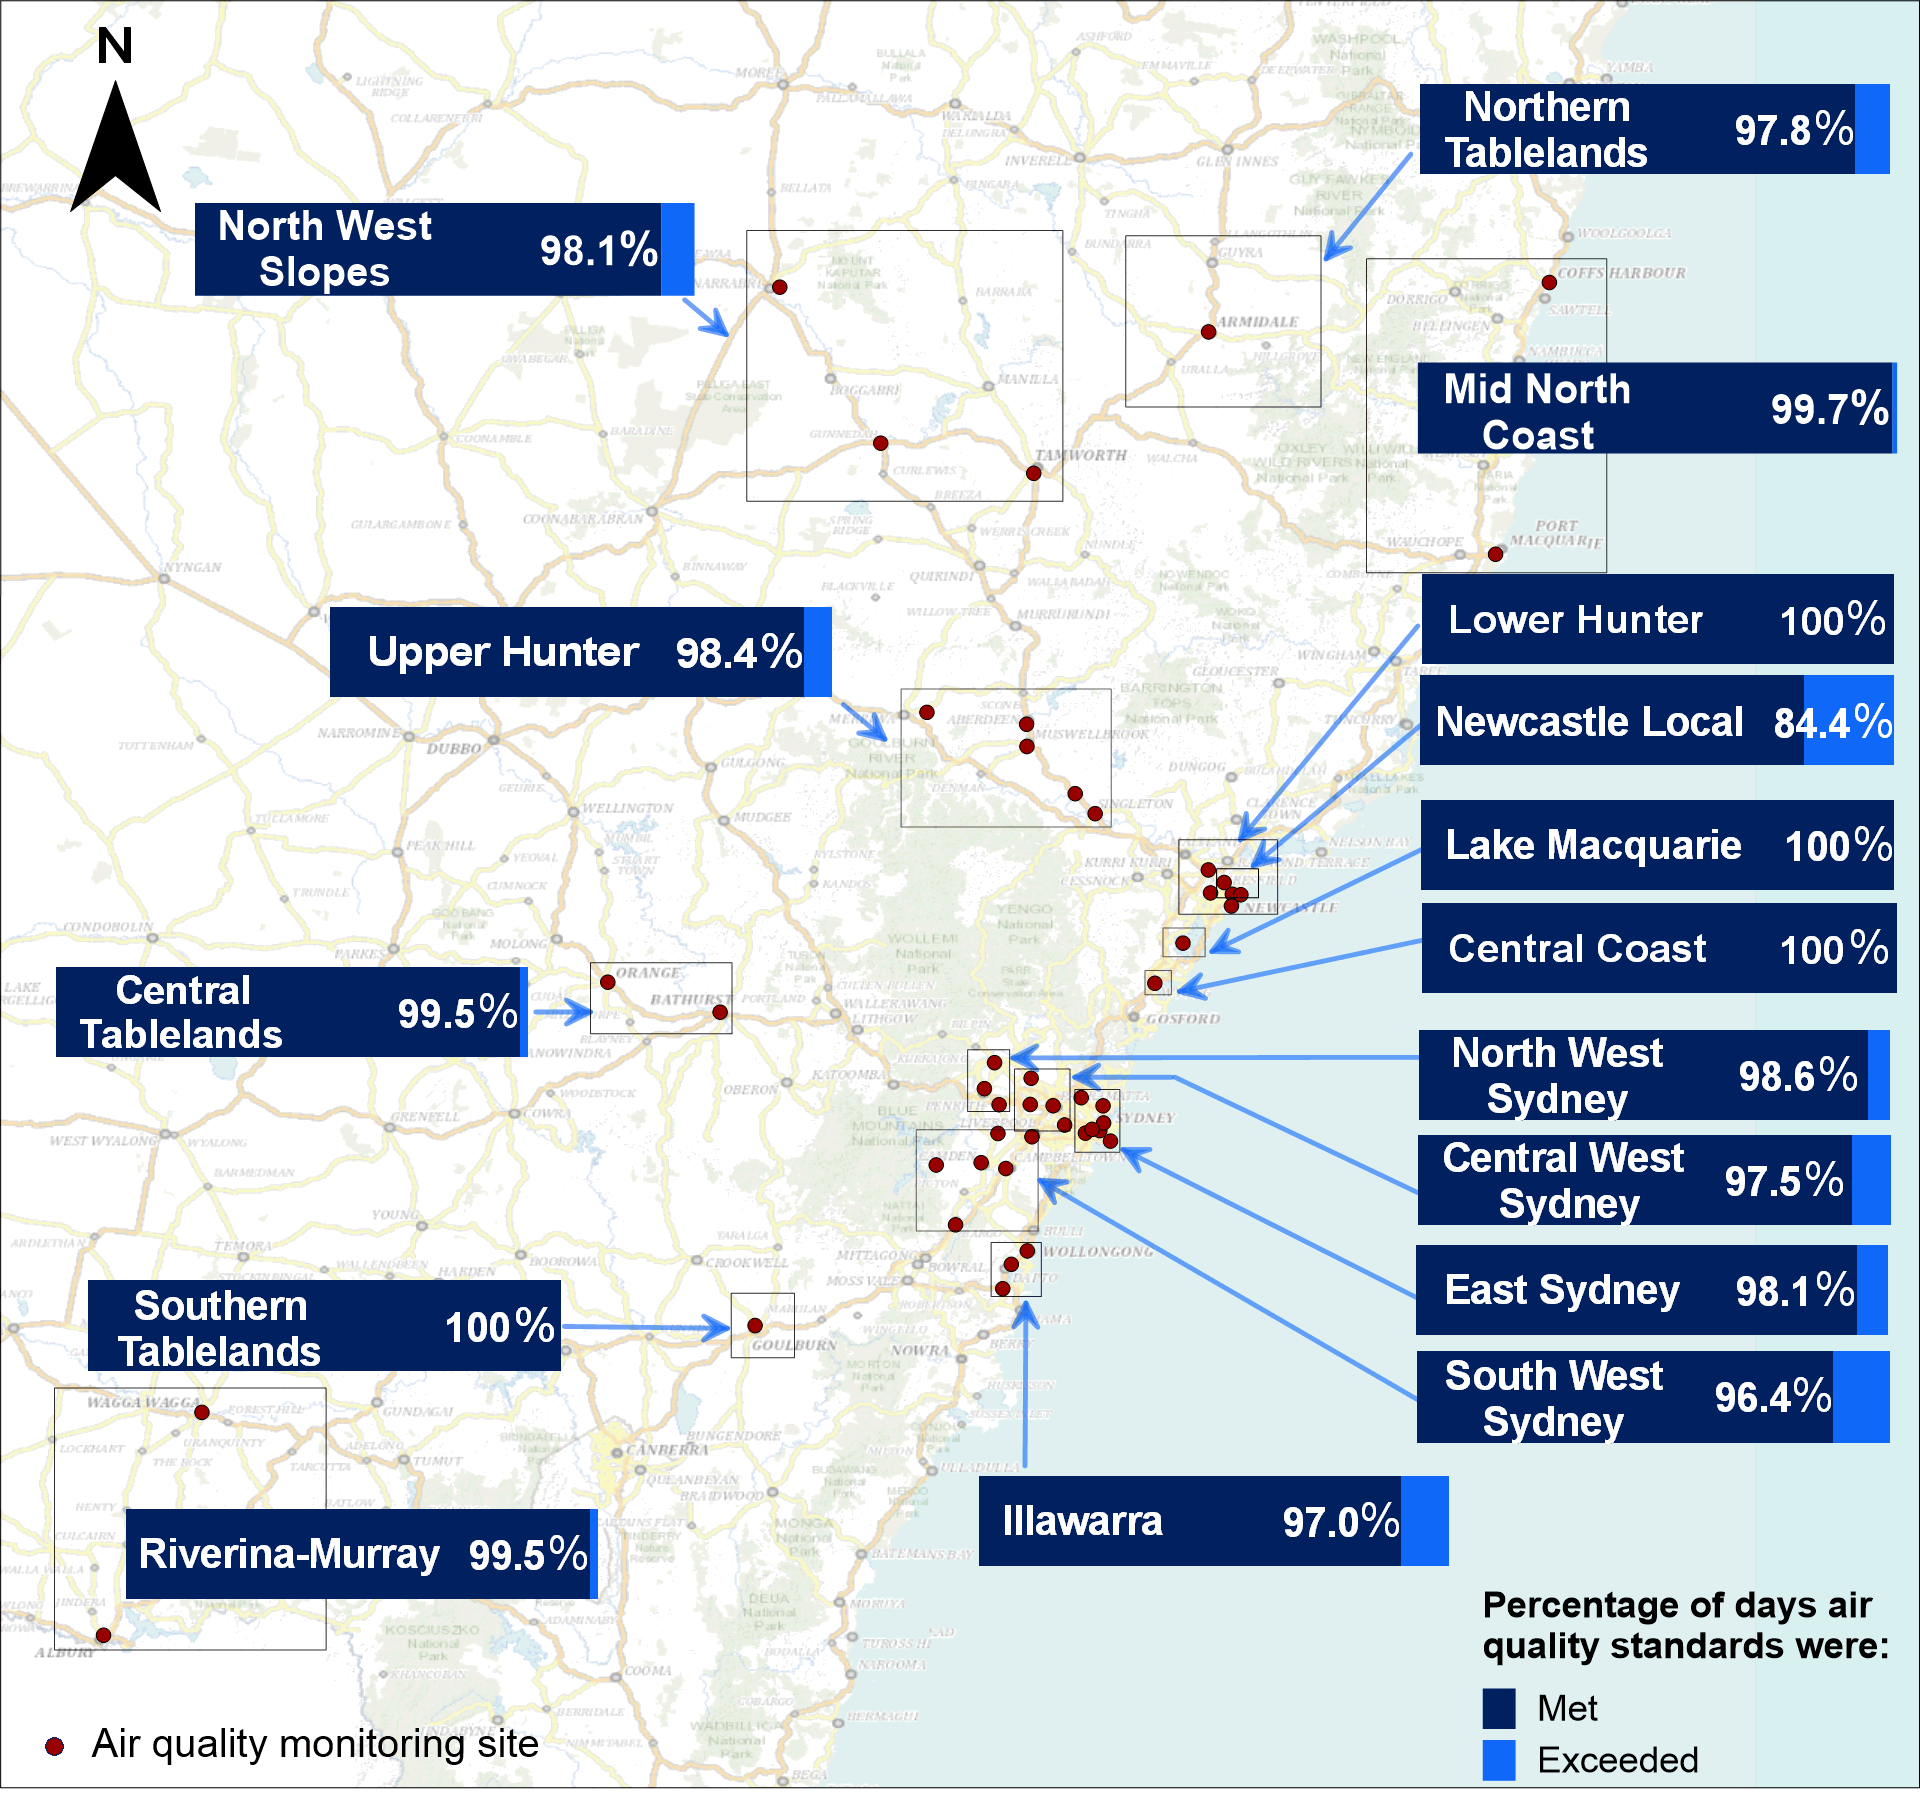
In 2023, pollutant levels met national standards every day in the Central Coast, Lake Macquarie, Lower Hunter and Southern Tablelands regions (see the Air quality summary map).
In contrast, during 2022, 9 regions had 100% compliance with national standards.
Air quality summary map for NSW regional and metropolitan centres
View the map below with bar charts showing the percentage of days that pollutant levels in different metropolitan and regional centres met air quality standards, which means air quality was good (dark blue). The percentage of days in each region where pollutant levels exceeded the standards indicates that air quality was not good (light blue).
Exceedance days
In 2023, there were 47 days with one or more air pollutant over a national standard (see Days exceeding national standards table).
Particles (such as PM10 and PM2.5) continued to be the pollutants that exceeded standards most frequently:
- Particles such as PM2.5 exceeded standards on 24 days, compared to 16 days in 2022.
- PM10 standards were exceeded on 30 days in 2023 compared to 2 days in 2022.
The increase in particle pollution was due to more exceptional events, such as hazard reduction burns and summer bushfires, but also some smaller-scale dust events (see Event days and Attributed causes).
Gaseous pollutants remained within the national standards except for:
- Sulphur dioxide (SO2), which had 2 days exceeding the one-hour SO2 standard (compared to one day in 2022). The 24-hour SO2 standard was also exceeded on one of these 2 days, the first time in 3 years that this standard was not met.
- Ozone (O3) exceeded the standard on 3 days in 2023. No ozone exceedances were recorded in 2022.
Local sources can also affect particle levels in the Hunter Valley and more information on these events can be found in the dedicated Hunter Valley focus area.
Days exceeding national standards at metropolitan and regional centre stations
| Pollutant | *Number of days exceeding standard in 2023 | Percentage of time standards were met in 2023 | *Number of days over standard in 2022 | Percentage of time standards were met in 2022 |
|---|---|---|---|---|
| Any pollutant exceeded | 47 | 87.1% | 19 | 94.5% |
| Particles as PM10 # | 30 | 91.8% | 2 | 99.5% |
| Particles as PM2.5 | 24 | 93.4% | 16 | 95.6% |
| Ozone, O3 | 3 | 99.2% | 0 | 99.7% |
| Sulphur dioxide, SO2 | 2 | 99.5% | 1 | 99.7% |
| Nitrogen dioxide, NO2 | 0 | 100% | 1 | 99.7% |
| Carbon monoxide, CO | 0 | 100% | 0 | 100% |
Notes:
- * On any given day, levels may exceed standards for multiple pollutants or at one or more air quality monitoring stations.
- # Stockton station data is excluded from this analysis.
Event days
Event days refer to days exceeding national standards (or exceedances) for particles and ozone, as defined by the National Environment Protection Measure (Ambient Air Quality) Measure (NEPM).
Event days are classified as exceptional when pollutant levels on the day are adversely affected by bushfires, hazard reduction burns or continental-scale or widespread windblown dust. Exceedances that are not caused by bushfires, hazard reduction burns and dust storms, or whose source cannot be determined, are non-exceptional.
Non-exceptional causes typically include sea salt, dust-generating activities such as construction or agriculture, woodsmoke from domestic wood heaters, and photochemical pollution events.
Particles
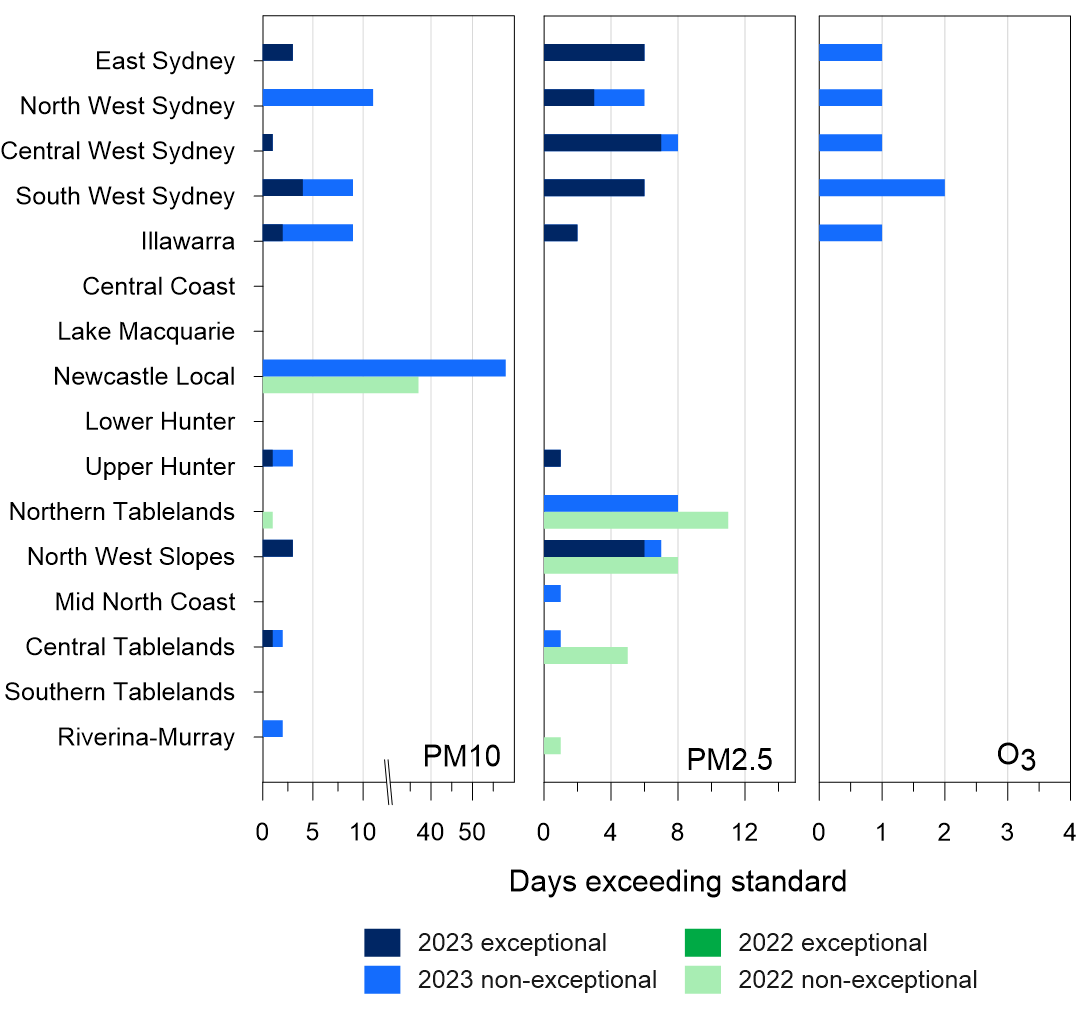
In 2023, particle events were affected by a mix of exceptional and non-exceptional causes. Exceptional event days for 2023 for each region are shown as dark blue bars in the Event days by region graph, and non-exceptional days for each region as light blue bars for 2023 (light green for 2022). In 2022, there were no exceptional events.
- Four regions recorded no particle events in 2023 (Central Coast, Lake Macquarie, Lower Hunter, Southern Tablelands).
- Nine regions saw an increase in particle events during 2023 compared to 2022 (all 4 Sydney regions, Illawarra, Newcastle Local, Upper Hunter, Mid North Coast, Riverina-Murray)
- Three regions had fewer particle events in 2023 than in 2022 (Northern Tablelands, Central Tablelands, North West Slopes).
Specific causes for each event are listed in Attributed causes.
Ozone
In 2023, there were 3 days of ozone pollution, compared to none in 2022. On 19 March widespread elevated ozone was recorded across the Sydney region. Two days in December exceeded the ozone standard: in South West Sydney (8 December) and the Illawarra (9 December).
These ozone event days were non-exceptional as they were not affected by jurisdiction authorised hazard reduction burns, but rather were influenced by hot and calm conditions during heatwaves.
Event days by region
The plot shows exceptional and non-exceptional event days in NSW air quality regions for PM10, PM2.5 and ozone (O3) in 2023 compared with 2022.
Notes:
- Days exceeding standards are divided into exceptional and non-exceptional events. Exceptional events are those related to bushfires, hazard reduction burns and continental-scale dust storms.
- On any given day, levels may have been over the standard for multiple pollutants at one or more air quality monitoring stations.
- This graph includes Stockton station in the Newcastle Local region.
Attributed causes
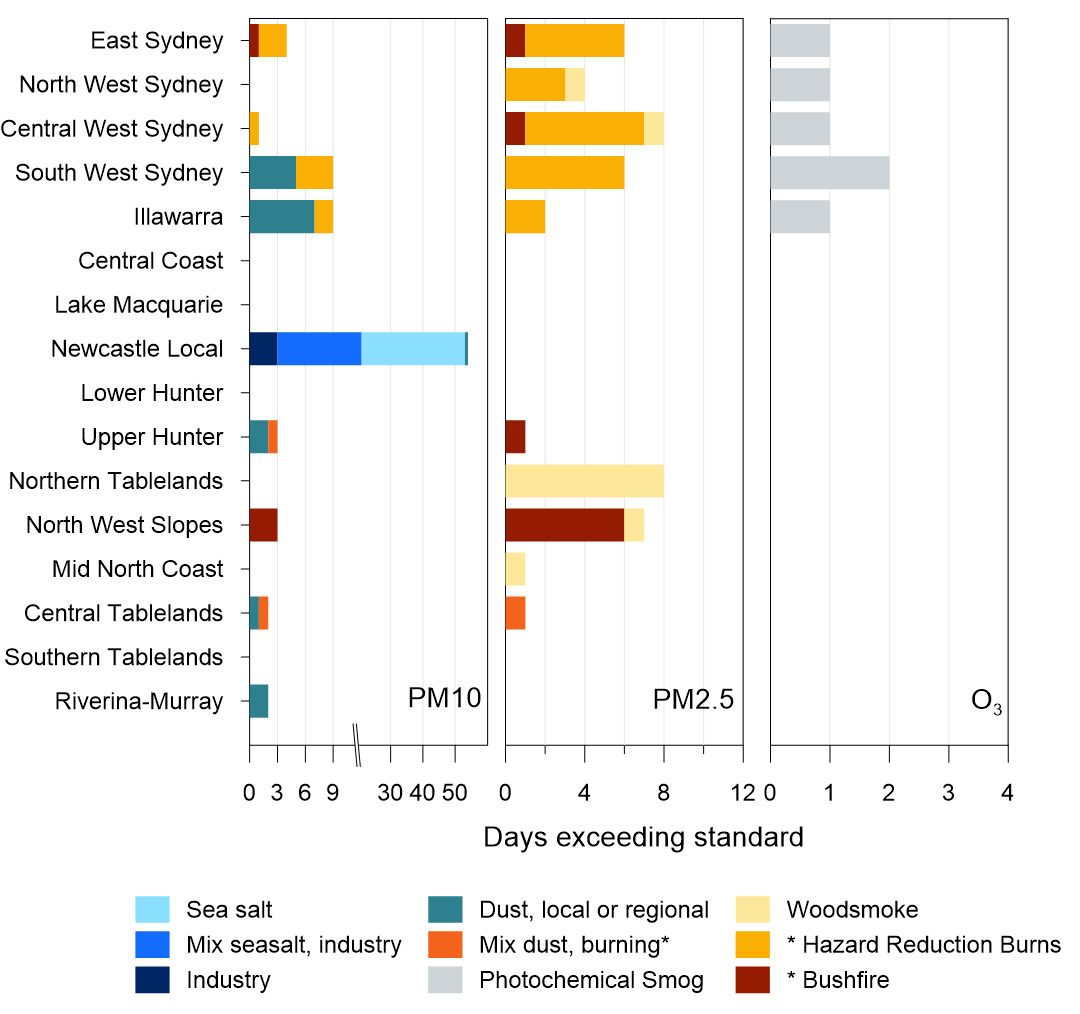
The Source attribution for event days graph presents causes that were identified as contributing to exceedances of PM10, PM2.5 and ozone.
Particles
Days exceeding particle standards represents distinct calendar days when either one or both of the PM10 or PM2.5 standards was exceeded within the region in 2023.
- East Sydney: 6 days exceeding particle standards. Five days were due to September hazard reduction burns, and one day was due to smoke from the Duck Creek Pilliga Forest bush fire in December.
- North West Sydney: 4 days exceeding particle standards, with one day due to winter woodsmoke and 3 days due to September hazard reduction burns.
- Central West Sydney: 8 days exceeding particle standards, with 6 days due to September hazard reduction burns, one due to winter woodsmoke, and one due to smoke from the Duck Creek Pilliga Forest bush fire.
- South West Sydney: 11 days exceeding particle standards, due to smoke from September hazard reduction burns (6), local dust at Bringelly (1), and agricultural activity at Bargo (4).
- Illawarra: 10 days exceeding particle standards due to smoke from September hazard reduction burns (3), dust at Wollongong (1) and local dust at Kembla Grange (6).
- Newcastle Local: 54 days exceeding particle standards, affected by sea salt, industry, a mix of sea salt and industry, and local dust. Most days due to sea salt at Stockton (see Hunter Valley focus area).
- Upper Hunter (larger population centres): 4 days exceeding particle standards, due to smoke from the Duck Creek Pilliga Forest bush fire (1 day), a regional dust event (1), local dust (1) and a mix of dust and grassfire (1).
- Northern Tablelands: 8 days exceeding particle standards all due to woodsmoke from domestic heating.
- North West Slopes: 7 days exceeding particle standards, with one day due to winter woodsmoke at Gunnedah, and 6 days due to smoke from the Duck Creek Pilliga Forest bushfire.
- Mid North Coast: one day at Port Macquarie due to woodsmoke.
- Central Tablelands: 2 days exceeding particle standards at Bathurst, one day during construction works as part of the Macquarie River Regeneration project, and one due to a combination of dust and possibly bushfire smoke from Alpha Road, Tambaroora.
- Riverina-Murray: 2 days exceeding particle standards, due to local dust at Wagga Wagga North station.
Ozone
Ozone affected all 4 Sydney regions and the Illawarra in 2023, with 3 days exceeding the national standard. All 3 days were influenced by hot and calm conditions during mild heatwaves, which are conducive to photochemical ozone formation.
Source attribution for event days
Plot showing the cause for exceedances of the PM10, PM2.5 and ozone (O3) standards across New South Wales in 2023.
Notes:
- * Exceptional causes, that is, pollutant levels on these days were deemed to be adversely affected by bushfires, jurisdiction authorised hazard reduction burns in 2023.
- On any given day, levels may have been over the standard for multiple pollutants at one or more air quality monitoring stations.
- This graph includes Stockton station in the Newcastle Local region.


