Hazard reduction burns in September and the Duck Creek/Pillaga Forest bushfire in December contributed to extremely poor PM2.5 concentrations on 5 days.
National standards for PM2.5
- Annual average – 8.0 micrograms per cubic metre of air (8.0 µg/m3)
- Daily average – 25 micrograms per cubic metre of air (25 µg/m3)
Annual average PM2.5 levels
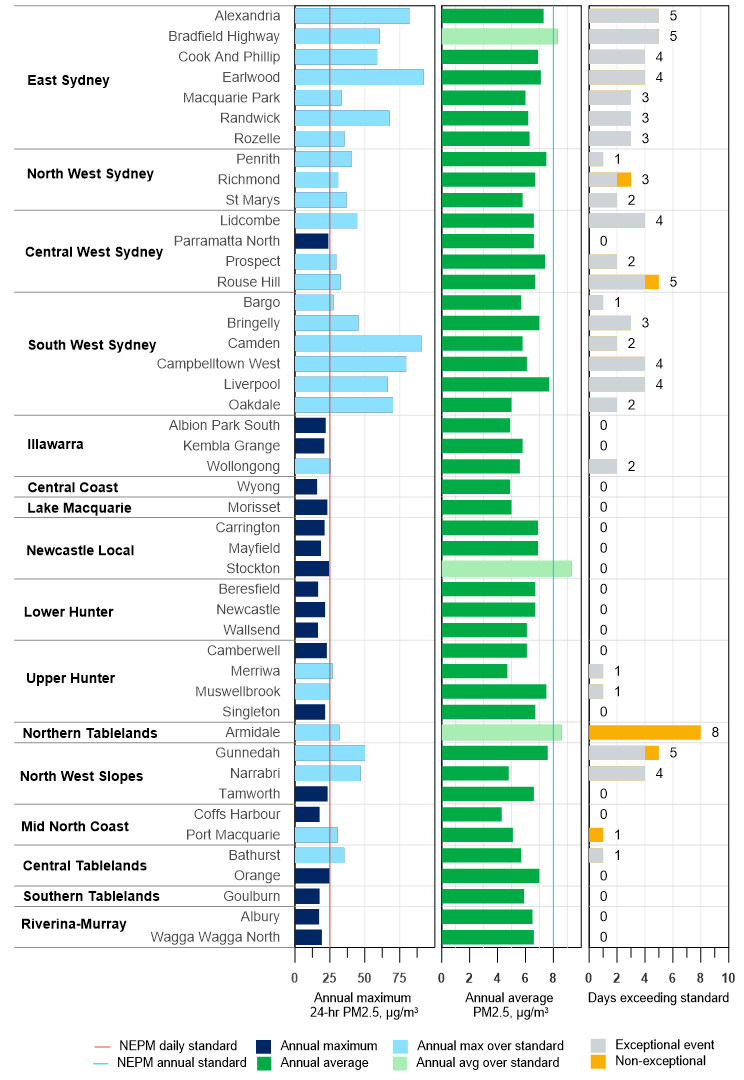
In 2023, all but 3 of 46 stations recorded annual average PM2.5 levels, which met the national standard (see PM2.5 daily and annual summary graph). In 2022, all stations met the standard.
Annual average PM2.5 during 2023 ranged from 4.3 µg/m3 at Coffs Harbour to 8.6 µg/m3 at Armidale. This compares with a range during 2022 of 2.7 µg/m3 at Morisset to 7.1 µg/m3 at Armidale.
The highest recorded annual average in 2023 was at Armidale (8.6 µg/m3), reflecting the influence of woodsmoke in winter. High annual average PM2.5 at Bradfield Highway is due mainly to traffic emissions but also reflects the added impact of 4 extreme air pollution days, due to the September hazard reduction burns.
Across the network, annual average PM2.5 levels increased by approximately 30% compared to 2022.
Stockton station in Newcastle Local region also exceeded the annual standard. See the Hunter Valley focus area.
Daily average PM2.5 levels
Exceedances of the daily average PM2.5 standard were recorded at 27 stations during 2023 (see PM2.5 daily and annual summary graph). This compares with 4 stations in 2022.
Daily average PM2.5 exceeded the national standard, at one or more stations on 24 days compared with 16 days during 2022.
During hazard reduction burns, the maximum daily average PM2.5 (92 µg/m3) was recorded at Earlwood on 12 September 2023. This was the most widespread and impactful PM2.5 event of 2023. Sydney experienced extremely poor air quality for 4 consecutive days with 9 stations seeing daily average PM2.5 levels more than twice the national standard.
Gunnedah station also saw extremely poor air quality during the Duck Creek Pillaga Forest bushfire, with daily PM2.5 of 50.1 µg/m3 on 17 December.

PM2.5 daily and annual summary
Bar chart summary of PM2.5 measurements in metropolitan and regional population centres measuring PM2.5. It shows for PM2.5, the maximum daily average, annual average, and exceptional and non-exceptional event days. Exceedances of the daily and annual standards are shaded darker. Note that all Upper Hunter stations measuring PM2.5 are shown in this plot, including Camberwell and Merriwa stations.
Note: Days exceeding standard are divided into exceptional and non-exceptional events. Exceptional events relate to bushfires, hazard reduction burns and continental-scale dust storms. These are not counted towards the NEPM (National Environment Protection Measures) goal of 'no days exceeding the particle standards in a year.'