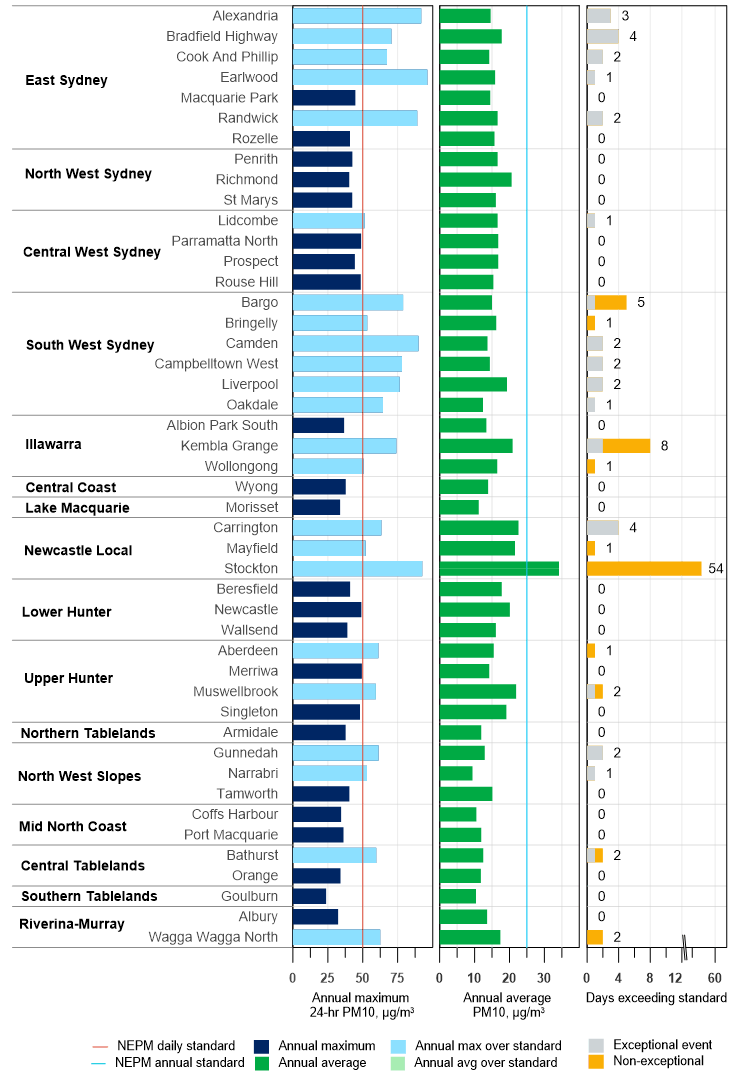
In 2023, daily PM10 particle exceedances increased to 30 days across 22 stations, compared to only 2 days at 2 stations in 2022.
National standards for PM10
- Annual average – 25 micrograms per cubic metre of air (25 µg/m3)
- Daily average – 50 micrograms per cubic metre of air (50 µg/m3).
Annual average PM10 levels
All stations met the standard for annual average PM10 (except Stockton).
Annual average PM10 levels ranged from 9 µg/m3 at Narrabri in the North West Slopes to 23 µg/m3 at Carrington in the Newcastle Local region. In 2022, annual average PM10 levels ranged from 7 µg/m3 at Narrabri to 19 µg/m3 at Carrington. See PM10 daily and annual summary graph.
In 2023, annual average PM10 increased by approximately 30% at most stations compared with 2022, which saw the lowest recorded average PM10 on record.
Daily average PM10 levels
Of the 46 metropolitan and regional population centre stations that monitor PM10, 22 stations exceeded the daily average national PM10 standard in 2023, compared with 2 stations in 2022 (see PM10 daily and annual summary graph).
Daily average PM10 levels exceeded the national standard at one or more of the 46 stations, on 30 days in 2023. This compares with 2 days in 2022.
In 2023, the highest daily PM10 level (96 µg/m3) was recorded during widespread hazard reduction burns at Earlwood station in Sydney East on 12 September. Six other Sydney stations also recorded their highest daily PM10 levels on this day.
Outside of the September hazard reduction burn events, the next highest daily PM10 was at Bargo in South West Sydney. Bargo recorded a daily average PM10 level of 79 µg/m3 on 30 September 2023, due to nearby agricultural activity.
Local industrial sources also affect particulate levels throughout the Hunter Valley. More information about particle levels in the Hunter can be found in the dedicated focus area.
PM10 daily and annual summary graph

PM10 daily and annual summary
Bar chart summary of PM10 measurements at NSW metropolitan and regional population centres. It shows, for PM10, the maximum daily average, annual average, and exceptional and non-exceptional event days. Exceedances of the daily and annual standards are shaded darker.
Note: Days exceeding standard are divided into exceptional and non-exceptional events. Exceptional events are those related to bushfires, hazard reduction burns and continental-scale dust storms. These are not counted towards the NEPM (National Environment Protection Measures) goal of 'no days exceeding (that is, exceeding) the particle standards in a year.'