The New South Wales Government operates 20 air quality monitoring stations in the Hunter Valley, including 3 government-funded stations in the Lower Hunter, 3 industry-funded stations around the Port of Newcastle (the Newcastle Local network), 13 industry-funded stations in the Upper Hunter and one mixed industry and government-funded background station at Merriwa.
The Upper Hunter and Newcastle Local monitoring networks were established in 2011 and 2014, respectively. These networks monitor ambient air quality to capture the influence of industrial and local pollution sources on air quality.
Due to stations' proximity to these sources, national ambient air quality standards are not applied to these stations' data, except for stations in larger population centres.
More information on these networks can be found on our pages, including seasonal newsletters and air quality monitoring reports.
Hunter large population centres
- Upper Hunter – Aberdeen, Singleton, and Muswellbrook
- Newcastle:
- Lower Hunter network – Beresfield, Newcastle, and Wallsend
- Newcastle Local network – Carrington, Mayfield, and Stockton
Gaseous pollutants
Ozone (O3), and nitrogen dioxide (NO2) remained below the relevant national benchmarks in the Upper Hunter, Lower Hunter, and Newcastle Local networks during 2023, the same as 2022.
In 2023, there were 2 days with 1-hour sulphur dioxide (SO2) levels exceeding the benchmark, both at Muswellbrook. On both days, light south-east to south-westerly winds prevailed when elevated levels were recorded. Under these wind conditions, the Muswellbrook station is downwind of industrial emissions from nearby power stations.
For detailed data on Muswellbrook, see Sulphur dioxide on the Gases page.
PM10 particles
Across the New South Wales air quality monitoring network, including the Hunter, PM10 levels generally are highest at Stockton in Newcastle Local region, due to the influence of sea salt under onshore winds (Lower Hunter Particle Characterisation Study).
For detailed data on the Hunter larger population centres, refer to the PM10 daily and annual summary graph, on the PM10 page.
Annual averages
In 2023, annual average PM10 levels ranged from 16 µg/m3 at Aberdeen to 23 µg/m3 at Carrington. Stockton exceeded the standard with a level of 34 µg/m3.
Daily averages
Daily average PM10 levels exceeded the benchmark on 8 days in Hunter population centres.
The maximum daily PM10 level in the Hunter population centres occurred at Carrington with a concentration of 63 µg/m3 on both 19 and 20 September 2023.
Carrington station was above the benchmark on 4 days, including 6 March 2023 and 3 consecutive days from 18 September to 20 September 2023. A regional dust event resulted in elevated PM10 on 6 March 2023.
On 18 to 20 September 2023, elevated PM10 around Newcastle was due to industrial activity during the mornings under light north-westerly winds, followed by sea salt in the afternoon under north-easterly winds as well as possible bushfire smoke (however, this could not be confirmed based on available data).
PM2.5 particles
Annual averages
Annual average PM2.5 met the 8.0 µg/m3 benchmark in 2023 at all stations except Stockton (PM2.5 is not currently recorded at Aberdeen). Stockton station recorded an annual average of 9.3 µg/m3. Wallsend recorded the lowest annual average PM2.5 of the Hunter larger population centres (6.1 µg/m3).
For detailed data on the Hunter larger population centres, refer to the PM2.5 daily and annual summary graph, on the PM2.5 page.
Daily averages
There was one day where daily average PM2.5 exceeded the benchmark in the Hunter larger population centres. On 19 December, Muswellbrook recorded daily PM2.5 of 25.2 µg/m3. This was due to smoke from the Duck Creek Pilliga Forest bushfire transported through the Hunter. No exceedances of the daily PM2.5 benchmark were recorded in the Hunter population centres in 2022 and 2021.
Upper Hunter
The Upper Hunter air quality monitoring network comprises 14 stations. There are 3 stations in larger population centres, 6 stations in smaller communities, 3 diagnostic stations close to mining operations and 2 background stations – one each at the north-western and south-eastern ends of the valley.
Annual averages
All but one monitoring station in the Upper Hunter recorded annual average PM10 levels, which met the 25 µg/m3 benchmark in 2023 (see Upper Hunter PM10 summary graph). The exception was Warkworth, which is located near mining operations. PM10 annual averages in the Upper Hunter ranged from 14 µg/m3 at Merriwa to 33 µg/m3 at Warkworth. The annual PM10 averages for each station were 40% higher in 2023 than in 2022.
All 4 stations monitoring PM2.5 in the Upper Hunter (Muswellbrook, Singleton, Camberwell, and Merriwa) recorded annual average PM2.5 levels met the 8.0 µg/m3 benchmark in 2023 (see PM2.5 daily and annual summary graph).
The PM2.5 annual averages ranged from 4.7 µg/m3 at Merriwa to 7.5 µg/m3 at Muswellbrook. This is the third year in a row that Muswellbrook and Singleton met the standard. PM2.5 exceedances at both stations are predominantly driven by woodsmoke in cooler months and bushfire and hazard reduction burn smoke during the warmer months.
Daily averages
Particles as PM10
Across the 14 Upper Hunter stations, there were 49 days when daily average PM10 levels were over the benchmark in 2023. In 2022, there were 2 days at 2 stations.
Days exceeding the PM10 daily benchmark were more frequent in September (6 days), October (13), November (3) and December (11). Collectively, these 4 months accounted for 33 PM10 exceedance days out of 49 (67%) in the Upper Hunter for 2023. Drier-than-average conditions, including the second-driest September on record, combined with warmer-than-average temperatures during winter and spring, likely resulted in intensifying drought conditions during this period.
There were widespread particle events in the latter half of 2023. The highest daily average PM10 level of 94 µg/m3 was recorded at Warkworth on 19 September 2023, during a regional dust event when 3 stations exceeded the benchmark.
The most widespread dust event was on 25 October 2023, when 7 stations exceeded the benchmark, the highest number on any one day. This was likely due to a mix of dust from long-range transport, and smoke from a large grass fire. On 19 December 2023, 4 stations, including Warkworth recorded PM10 levels exceeding the benchmark because of smoke from the Duck Creek Pilliga Forest bushfire near Narrabri.
Special note on Warkworth and Mount Thorley
Warkworth recorded most days (42) over the PM10 daily benchmark in the region, a significant increase from one day during 2022 (see Upper Hunter PM10 summary graph). Mount Thorley recorded 18 days exceeding the benchmark in 2023, compared with zero days in 2022. The significant increases in PM10 at both Warkworth and Mount Thorley largely occurred during the final 4 months of the year.
Geographically, the 2 stations are relatively close. Warkworth sits between open cut coal mines and is situated on the southern side of the Hunter Valley, near the Wollemi State Conservation Area. Mount Thorley is located to the south-east of Warkworth, with an open cut coal mine to its west. That the increase in PM10 exceedances was largely restricted to these 2 stations reflects a combination of mining activity together with dryer conditions related to El Niño. Successive La Niña events from 2020 to 2022 significantly reduced dust in the recent past at these stations.
Particles as PM2.5
All stations in the Upper Hunter network met the annual average PM2.5 standard in 2023 (see PM2.5 daily and annual summary graph on the PM2.5 page).
The Upper Hunter did experience one day exceeding the daily average PM2.5 benchmark on 19 December 2023, as smoke dispersed south-east from the Duck Creek Pilliga Forest bushfire. This resulted in PM2.5 exceedances at Merriwa, with an average of 27 µg/m3, and Muswellbrook, with an average of 25.2 µg/m3. This compares relatively favourably with 2022 and 2021, when no days over the daily PM2.5 benchmark were recorded.
Upper Hunter PM10 summary
The bar chart shows the maximum daily average, annual average, and days exceeding the PM10 benchmark for each of the 14 stations in the Upper Hunter.
Note: Exceedance days have not been divided into exceptional and non-exceptional events, as the NEPM compliance goals are not applied to smaller community, diagnostic or background stations.
Stockton
This section examines air quality at Stockton monitoring station, a coastal station located near industrial activities in the Port of Newcastle.
The Stockton air quality monitoring station is part of the industry-funded Newcastle Local Air Quality Monitoring Network, located around the Port of Newcastle. The Stockton station is approximately 300 metres from the ocean and 20 metres from the Hunter River.
Due to Stockton's proximity to the coast, the Lower Hunter Particle Characterisation Study found the largest contributor to Stockton's PM10 observations is sea salt. This proximity often results in Stockton recording the highest number of days exceeding the PM10 benchmark across the NSW air quality monitoring network.
Sea salt as PM10 is observed at Stockton when onshore north-easterly to south-easterly winds dominate, especially during the warmer months of October to March.
PM10 particles
There were 54 days at Stockton in 2023 over the PM10 particle benchmark of 50 µg/m3, compared with 37 days in 2022. Sea salt was a primary contributor on 51 or 94% of days, and the remaining 3 days were primarily industry-influenced.
Of the 51 days when sea salt was a primary contributor, 41 occurred in the warmer months of January to March and October to December, when onshore winds typically prevail. The remaining 10 days occurred mostly from April to September when transitioning to and from to warm conditions.
On 18 of these 51 days, elevated PM10 were also associated with north-westerly winds and elevated co-pollutant levels. On these 18 days, a mix of sea salt and industrial activity influence from the north-west were the likely sources of elevated PM10. Stockton recorded its maximum daily average of 93 µg/m3 on 19 September 2023, influenced by a mix of sources.
In 2023, Stockton was the only metropolitan and regional centre station to exceed the annual PM10 standard of 25 µg/m3. The annual average PM10 level reached 34 µg/m3 at Stockton in 2023. This was the highest since 2020, and a slight increase on 30 µg/m3 for both, 2022 and 2021, which were the 2 lowest levels since records began in 2015.
PM2.5 particles
There were no days over the PM2.5 benchmark of 25 µg/m3 at Stockton in 2023, similar to 2022 and 2021. Stockton's highest daily PM2.5 average almost exceeded the PM2.5 daily benchmark on 18 September 2023 with a 24-hour average of 24 µg/m3, likely due to industrial emissions.
Stockton's annual PM2.5 average in 2023 of 9.3 µg/m3 exceeded the national benchmark of 8.0 µg/m3, and was Stockton's highest PM2.5 annual average since 2020. In 2022, Stockton recorded an annual average of 7.5 µg/m3. At Stockton, annual PM2.5 concentrations can be affected by sea salt and primary ammonium nitrate particles.
Ammonia
Hourly ammonia (NH3) levels met the assessment goal of 46 pphm at Stockton throughout 2023. The maximum hourly NH3 level was 28 pphm, recorded on 17 April 2023, compared to 38 pphm in 2022. The annual average ammonia level for 2023 was 1.6 pphm, which is equal to 2015, the highest annual average for ammonia since records began in 2015. The annual average for ammonia in 2022 was 1.2 pphm.
Stockton pollution roses
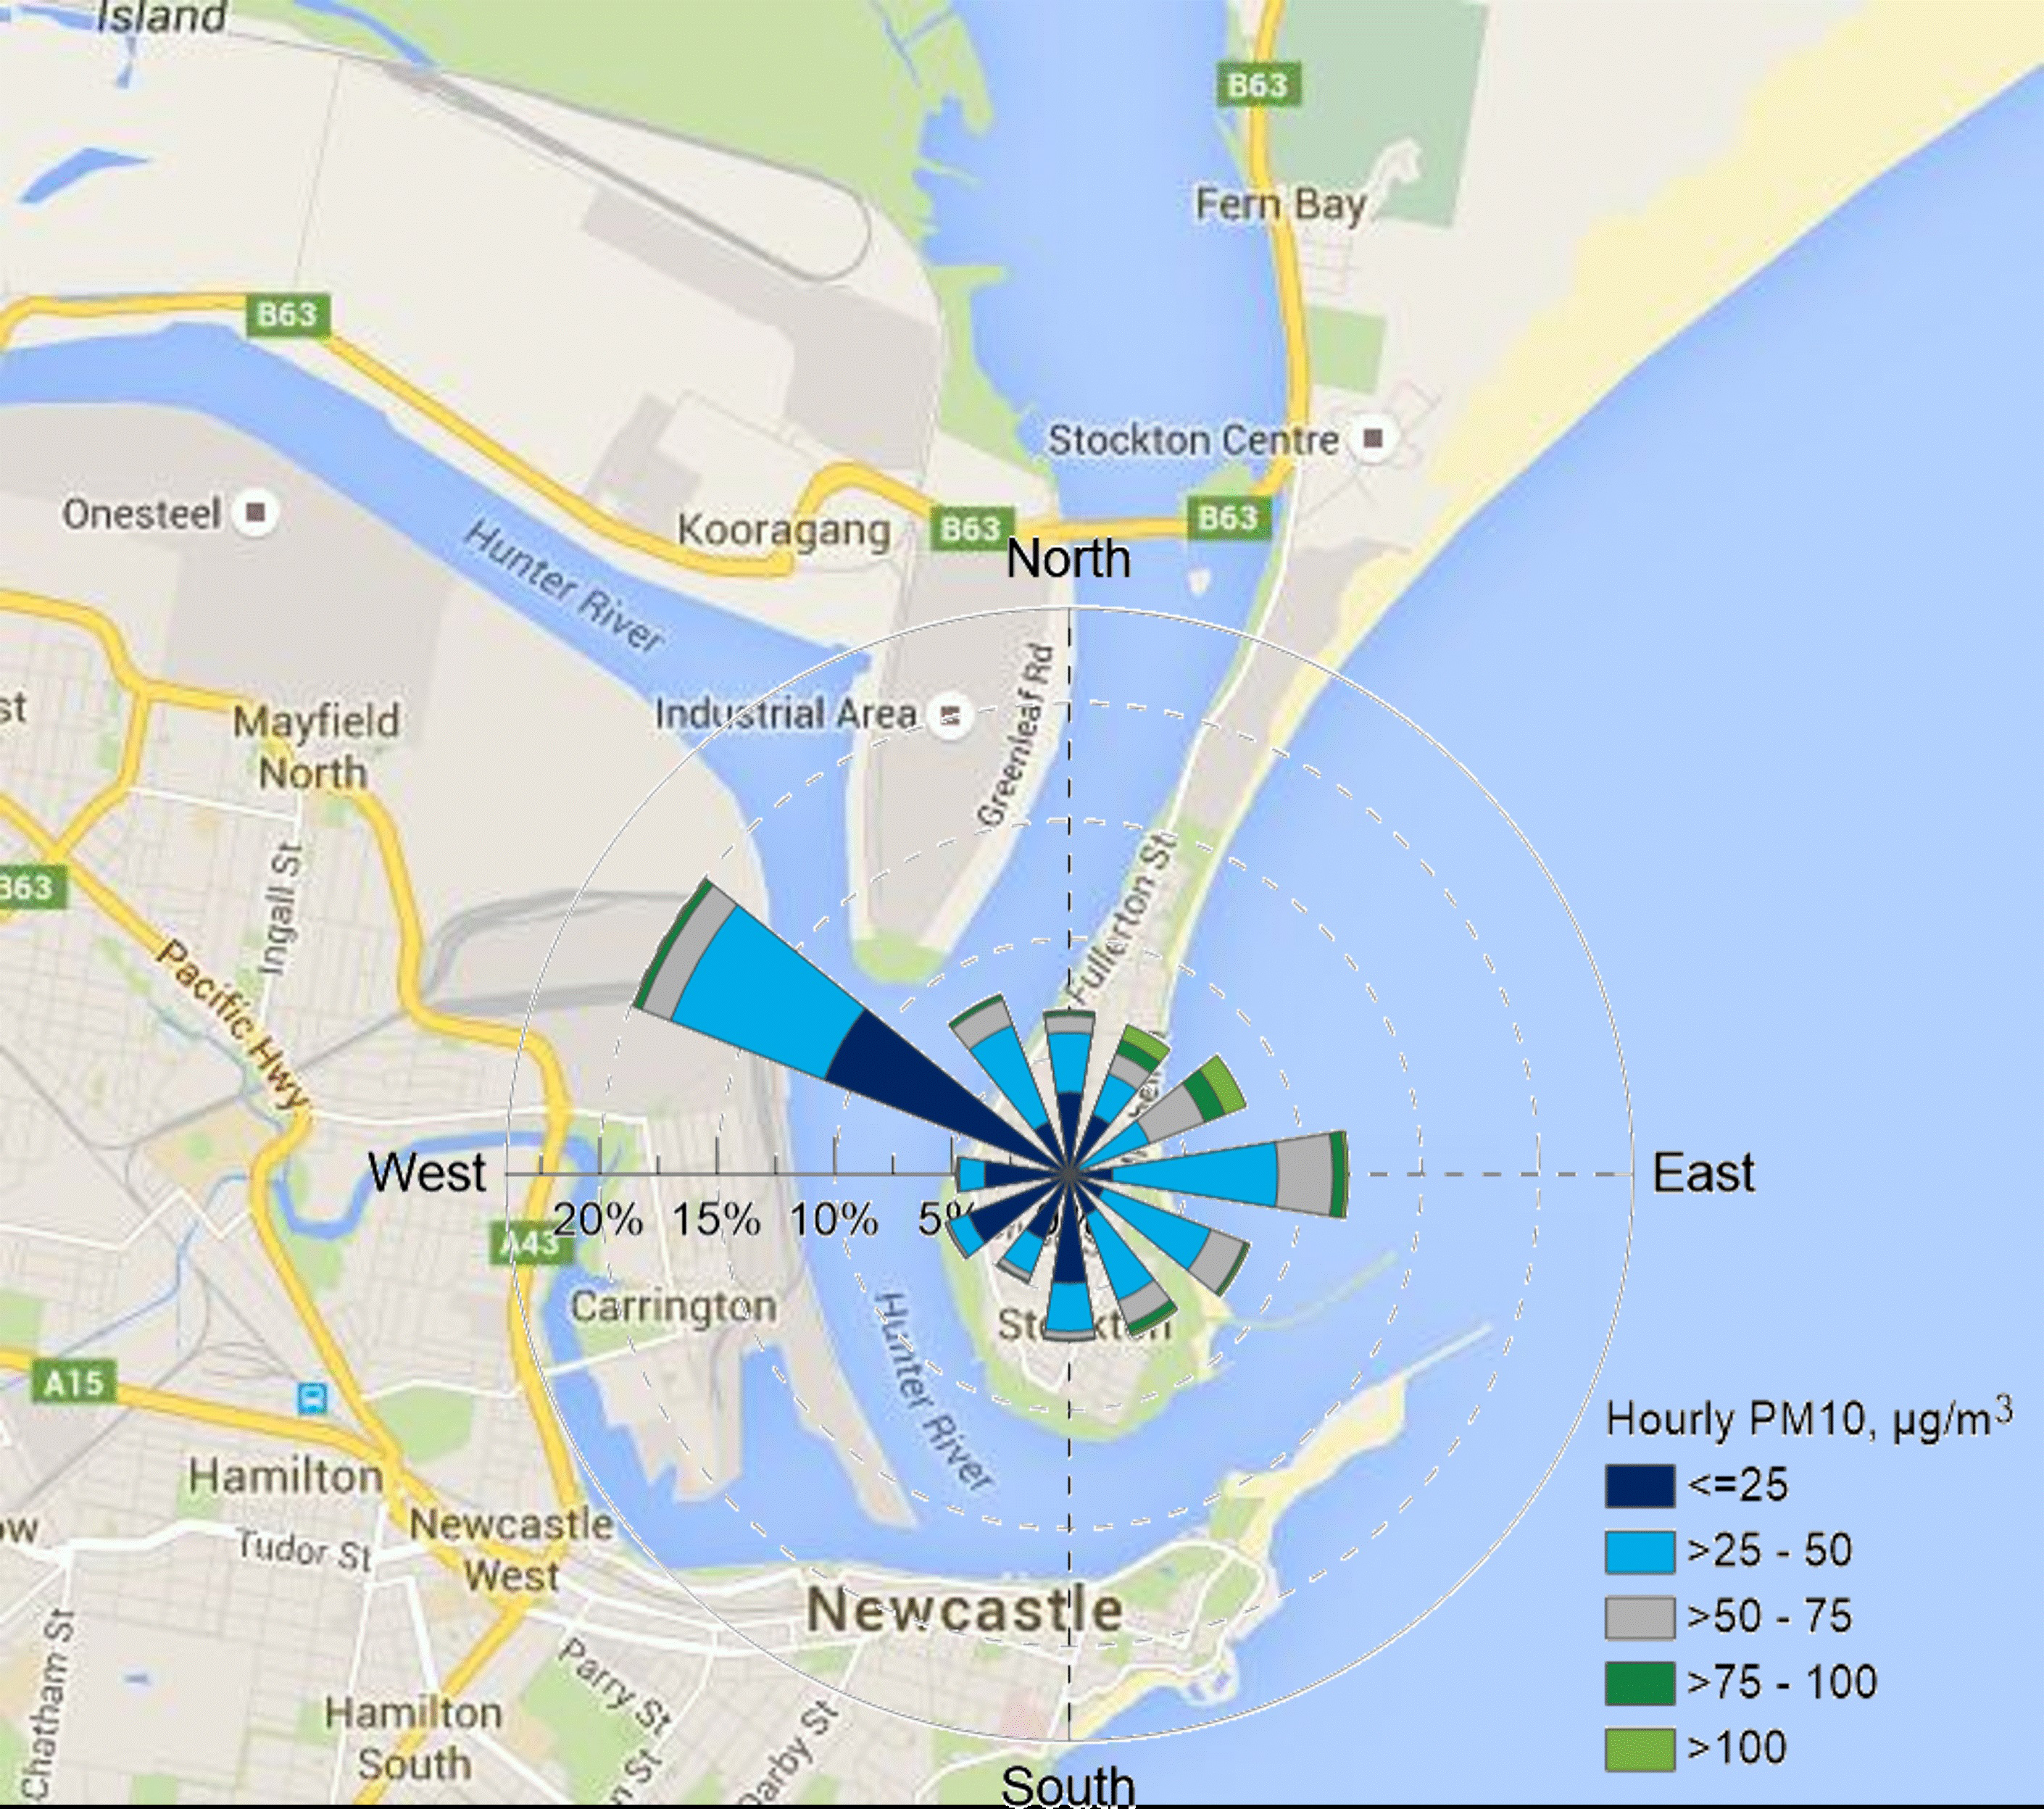
The Stockton PM10 pollution rose shows that higher PM10 levels are primarily recorded during onshore north-easterly to south-easterly winds (see Stockton pollution roses charts).
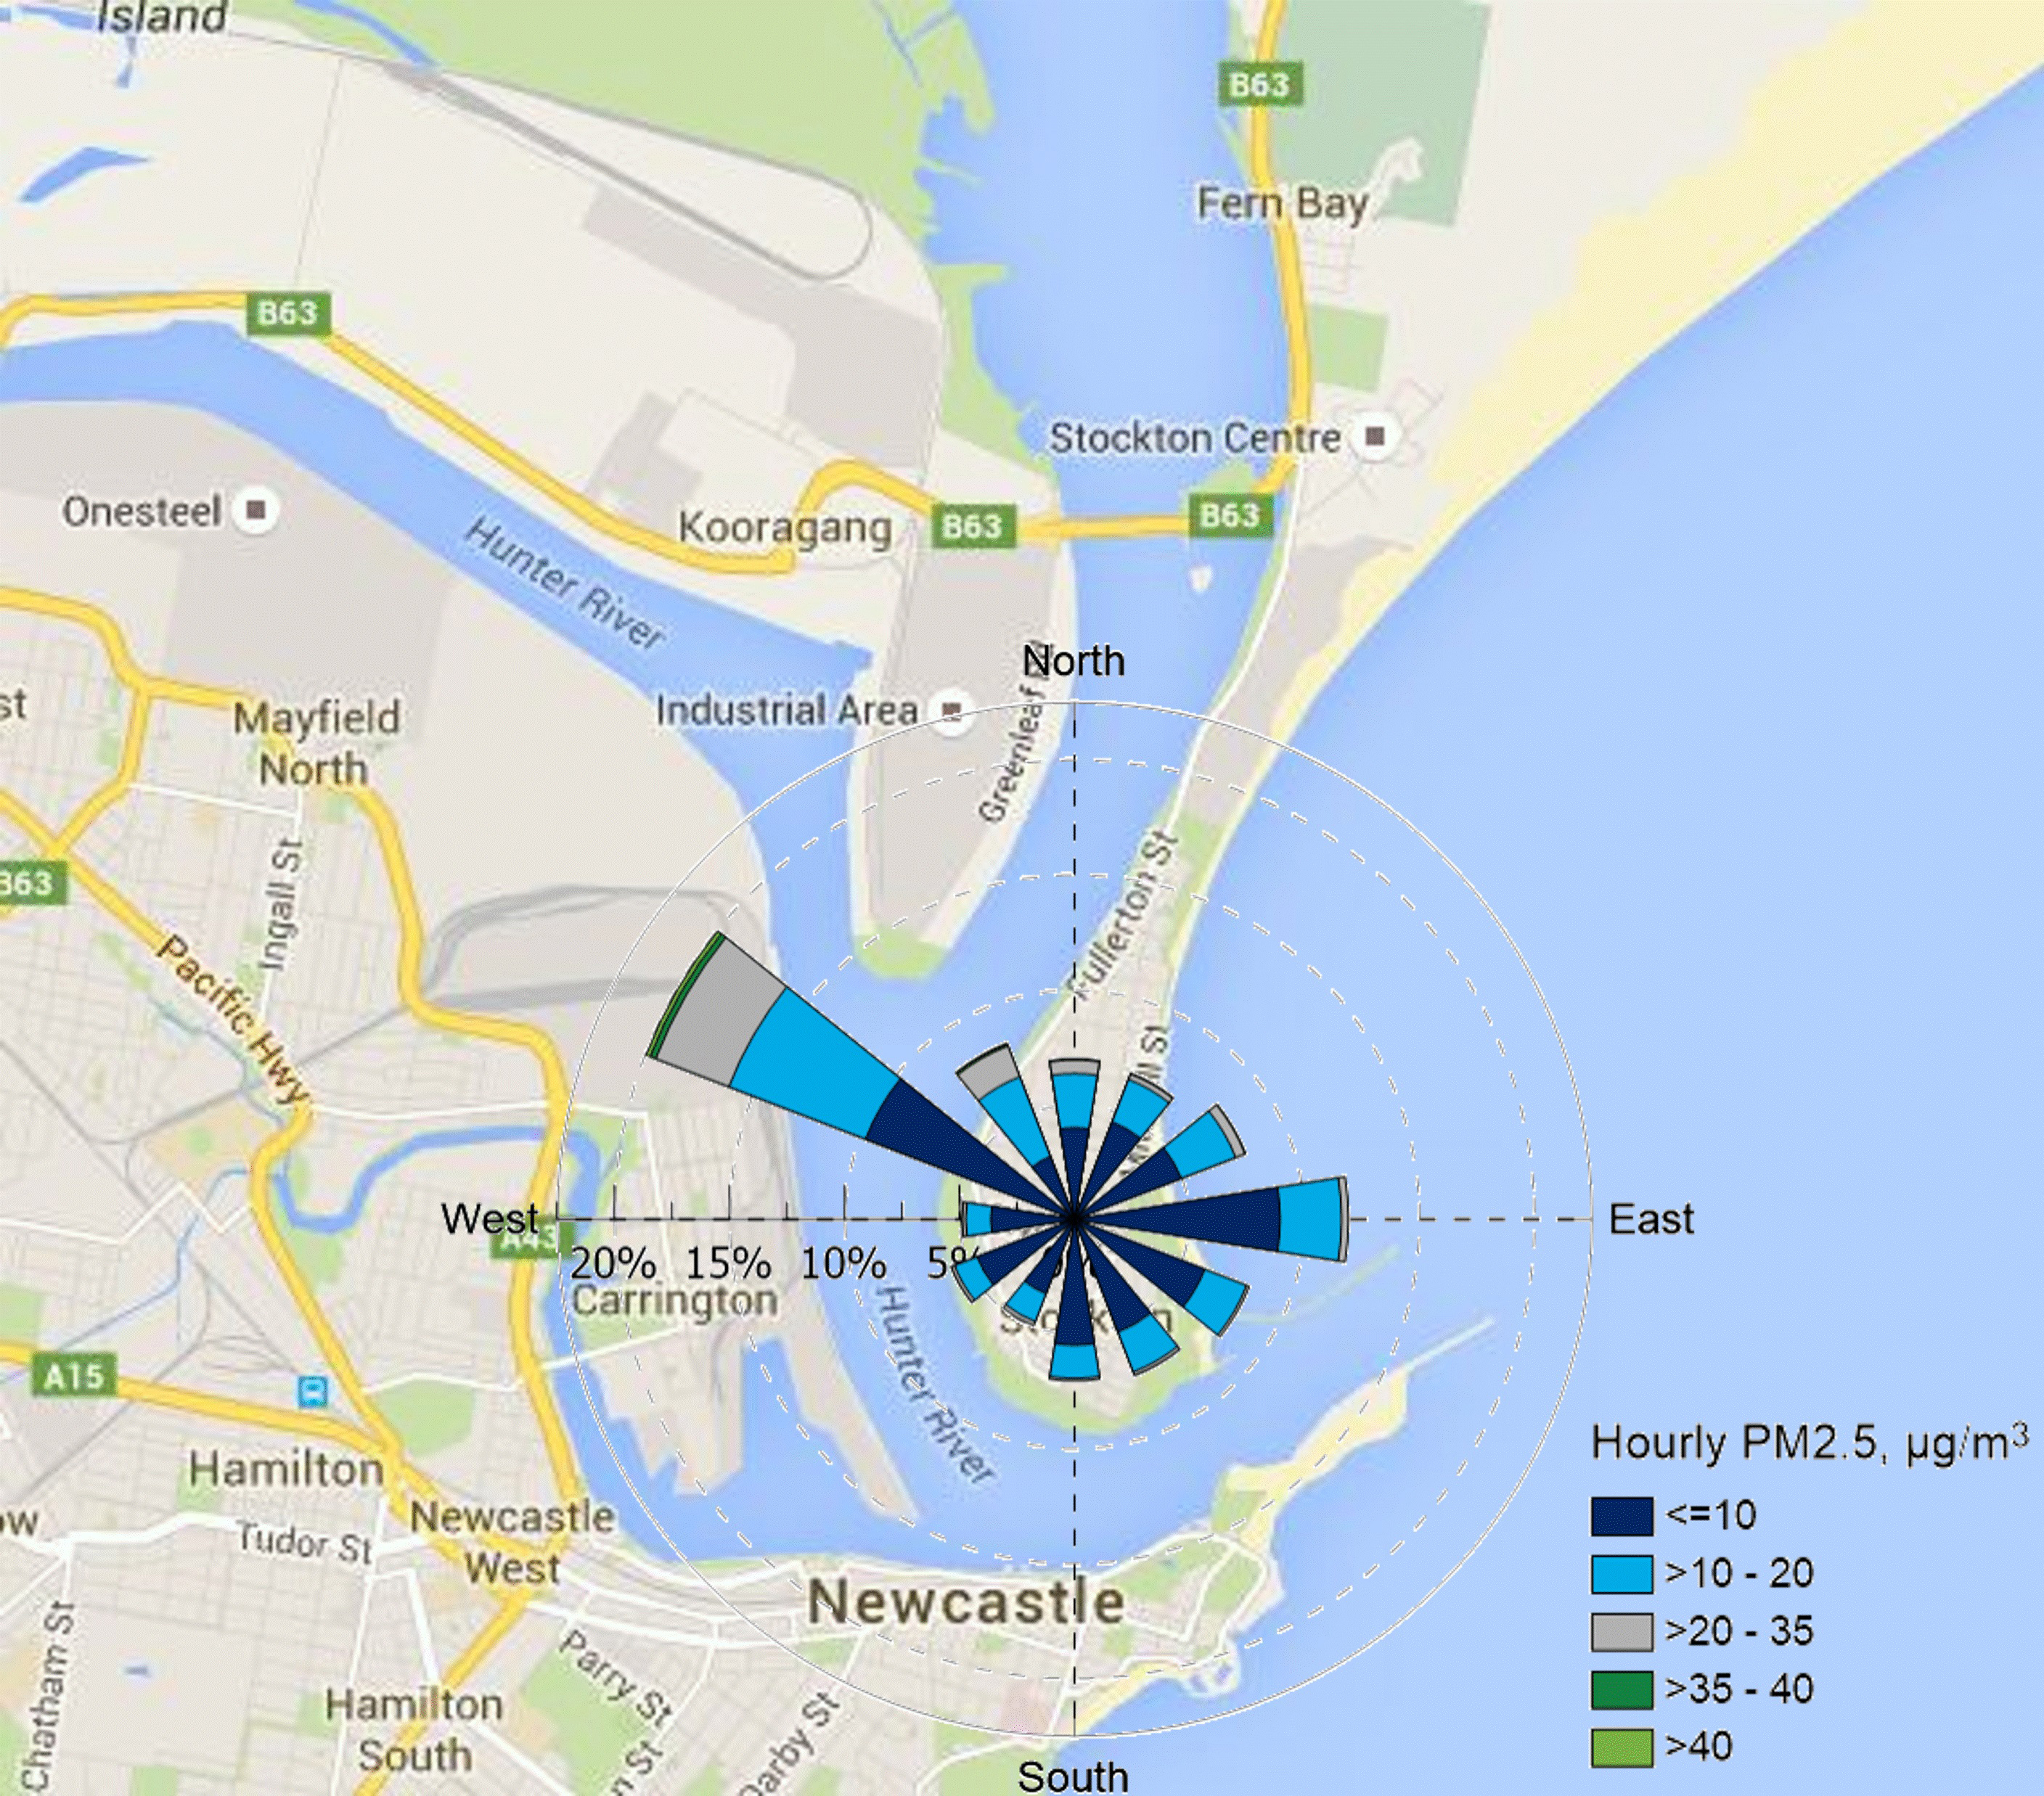
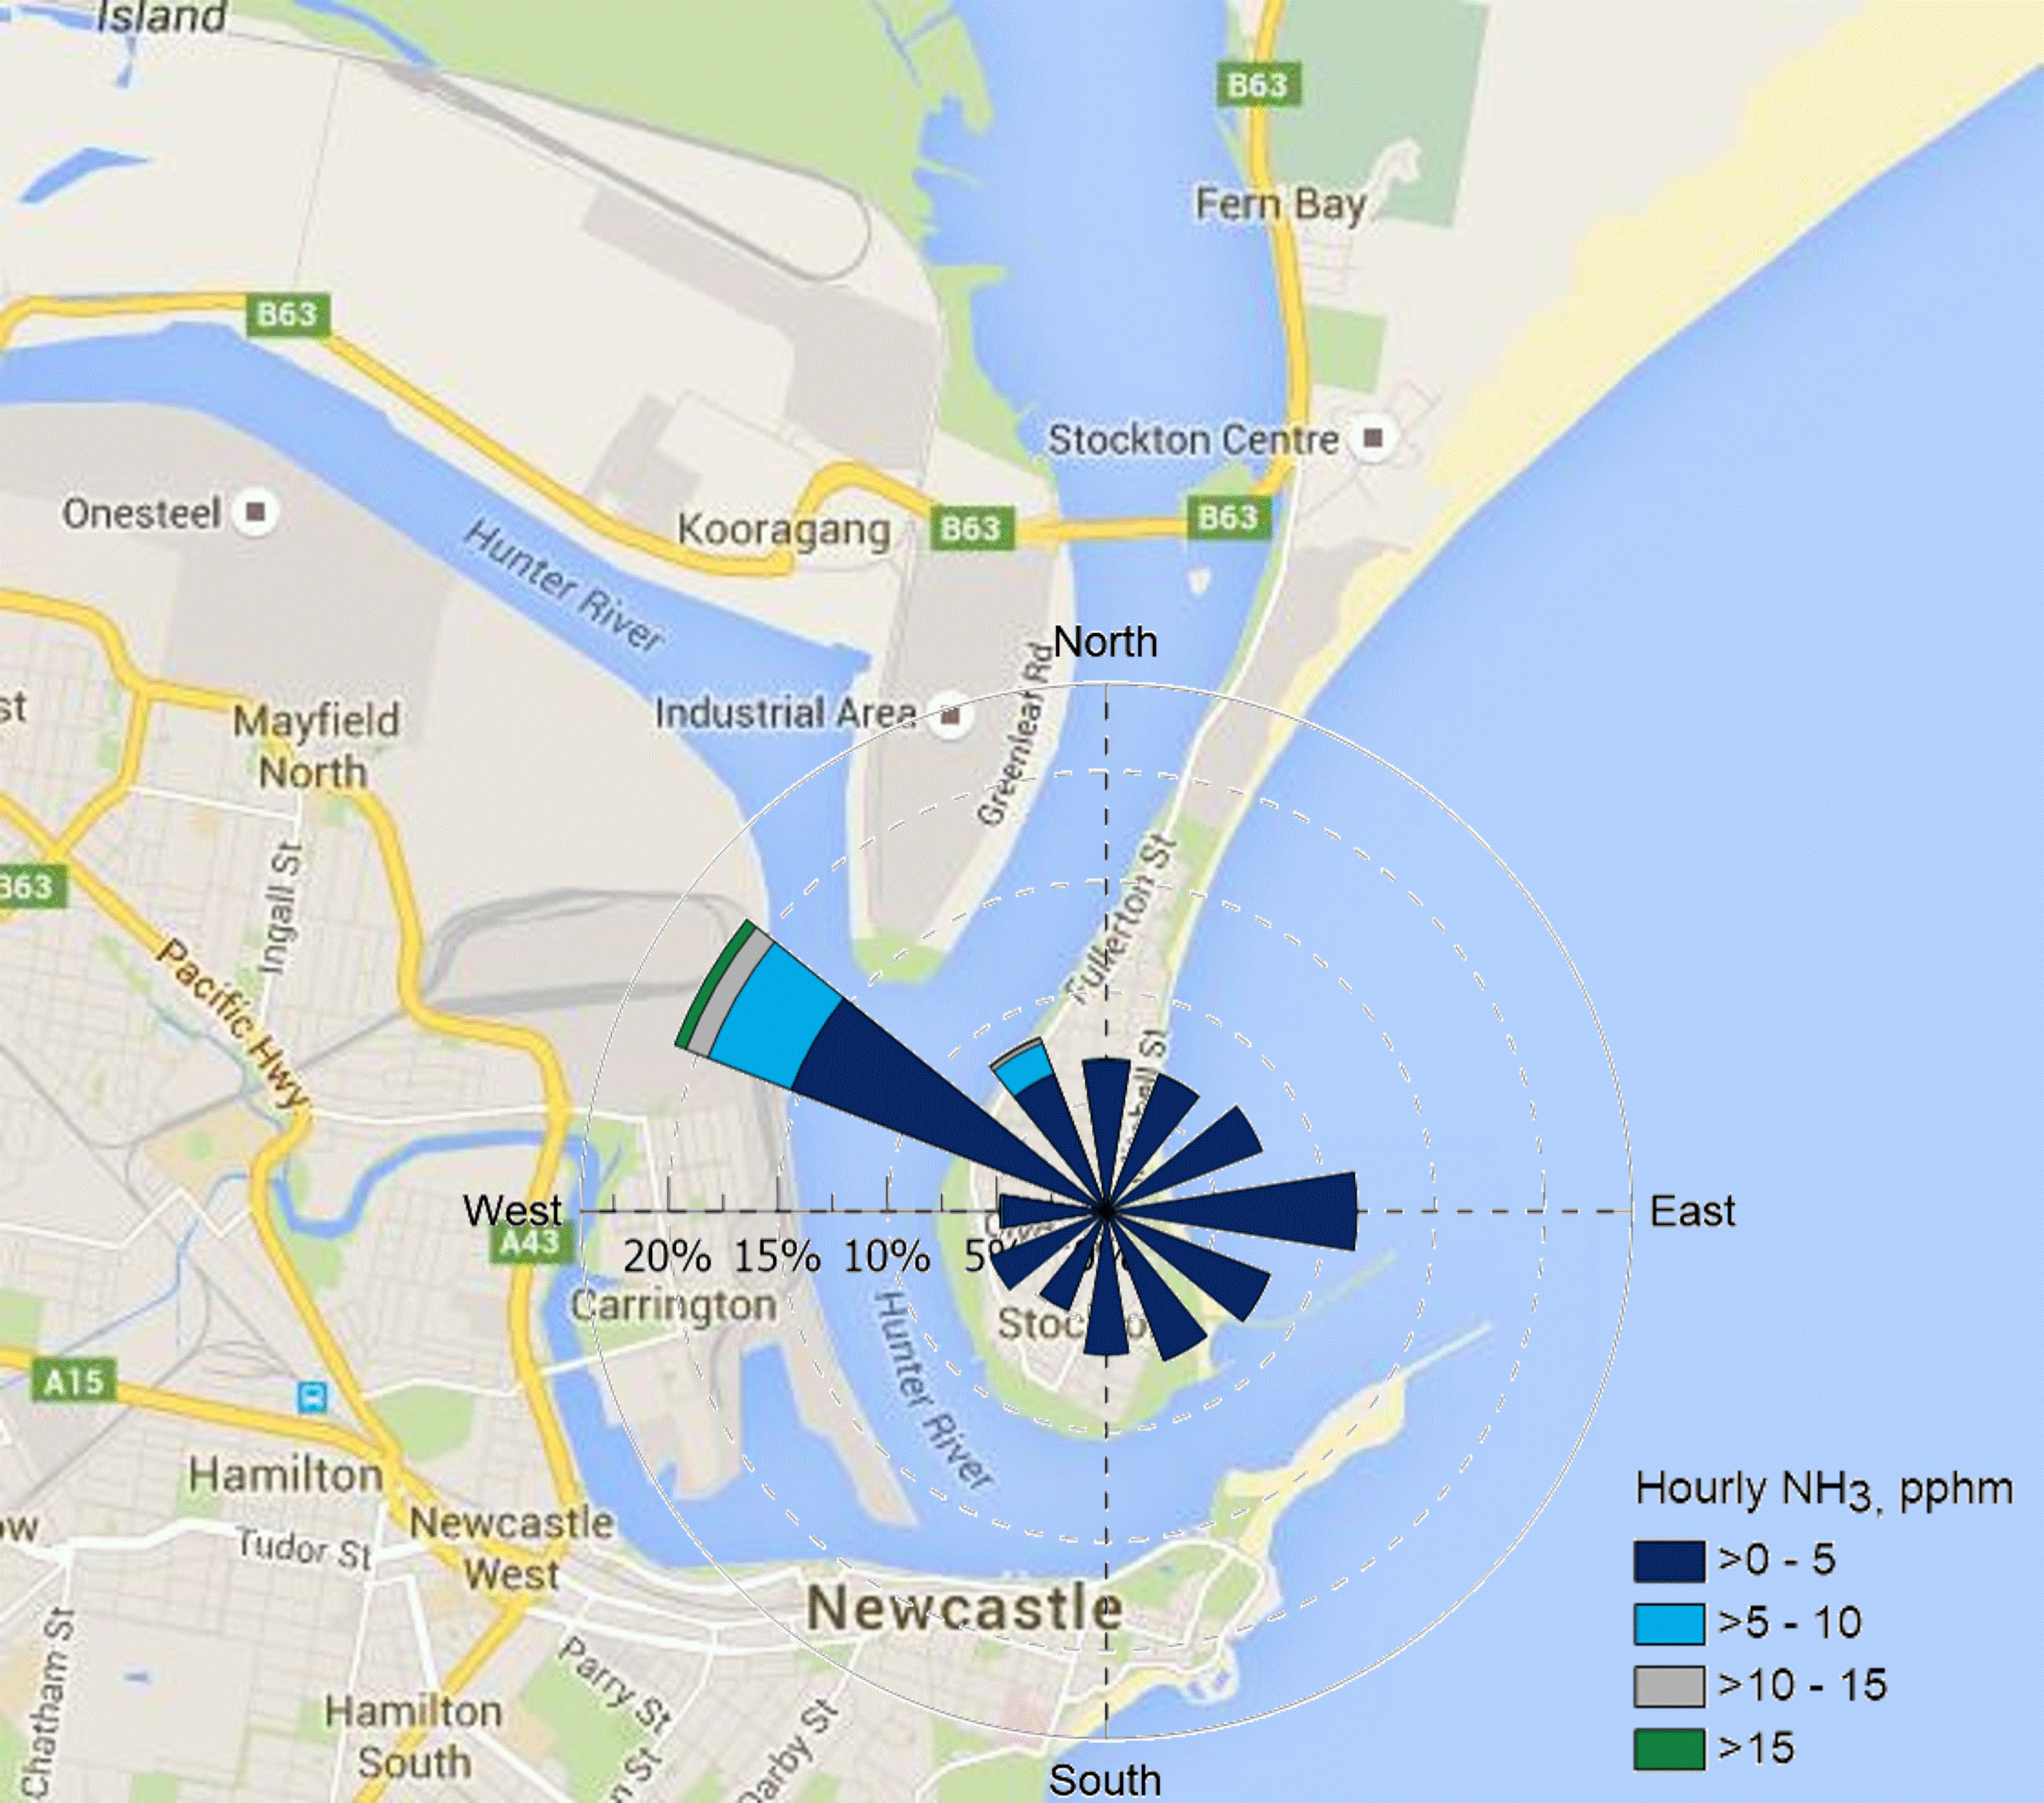
The Stockton PM2.5 and NH3 pollution roses show that hourly PM2.5 and NH3 levels remained low throughout the year at Stockton. The highest levels of these pollutants were associated with north-westerly winds.
Stockton pollution roses charts
Pollution roses of hourly PM10, PM2.5 and ammonia (NH3) for 2023 at Stockton. Pollution roses show the wind direction and pollutant levels. The length of each bar around the circle shows the percentage of time the wind blows from a particular direction. The colours along the bars indicate categories of pollutant levels. Higher average concentrations are shown in light green, whereas lower concentrations are shown in dark blue.
For more information on seasonal air quality at Stockton, refer to the Newcastle seasonal air quality monitoring newsletters.
More information
- Upper Hunter air quality monitoring reports
- Newcastle and Central Coast air quality monitoring reports
- Air quality monitoring in the Lower Hunter and on the Central Coast
- Air quality monitoring in the Upper Hunter
- Current air quality in Lower Hunter
- Current air quality in Upper Hunter
- Lower Hunter Particle Characterisation Study