Air quality in the Greater Metropolitan Region
When Action for Air was released
Our air quality has generally been improving since the 1980s. This was evident at the time Action for Air was released in 1998.
Ambient levels of carbon monoxide and lead had fallen dramatically and at that time were mostly well below national standards. These improvements were due to cleaner motor vehicle technology, mainly the introduction of catalysts and unleaded petrol. Sulfur dioxide concentrations were also well below the national standard. Around large point sources, like the smelting operations in Wollongong, concentrations were higher, but still below the standard.
In the decade prior to 1998, concentrations of ozone exceeded the Air NEPM standards on a number of days. These often coincided with major bushfires in the Sydney Basin.
During the 1990s nitrogen dioxide levels (and exceedences of the standards) were significantly lower than those recorded in the 1980s. However peak concentrations in the five years to 1998 were clustered around the national standard.
In the seven-year period prior to the release of Action for Air, the Sydney region would have met the 24 hour PM10 Air NEPM goal, except in 1991, 1994 and 1997 as a result of bushfires in the area.
Back to top
Current picture
Regional (area-wide) air pollutants
There has been little change in the trends for monitored air quality since 1998. Those pollutants which were below national standards in 1998 continue at low levels while the ozone and particle pollution levels remain a challenge.
Ambient concentrations of lead have continued to fall since 1998 as the number of vehicles using leaded petrol continues to decline. The sale of leaded petrol has been prohibited since 1 January 2002, eliminating the major source of ambient levels of lead. Given the low levels, NSW ceased monitoring for lead from the end of December 2004. Likewise, carbon monoxide concentrations have continued to fall with the gradual replacement of the vehicle fleet with vehicles meeting more stringent emission limits. Since 1998 exceedences of the national standard for nitrogen dioxide have also been rare.
Sulfur dioxide concentrations continue to be well below the national standard in Sydney and the Lower Hunter. In the Illawarra, concentrations were below the standard around its major point source – the copper smelter at Port Kembla – even when the plant was operating. Its subsequent closure has led to further reductions in sulfur dioxide concentrations in surrounding areas.
There is no trend to indicate improvement in ozone levels (Figures 1–4). Notwithstanding the variability in levels and exceedences due to weather, the underlying emissions mix that forms ozone in the air shed (mainly volatile organic compounds and oxides of nitrogen) remains high.
The ozone standards have been exceeded in Sydney and the Greater Metropolitan Region on a number of days each year. In 2001 and 2002 some of these were days when bushfires blazed, which added to the emission load. Nevertheless, even without the bushfires, ozone would still have breached the 2008 goals at times.
Back to top
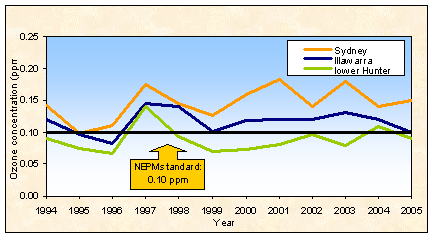
Figure 1: Annual maximum one-hour ozone concentration in the Greater Metropolitan Region, 1994–2005
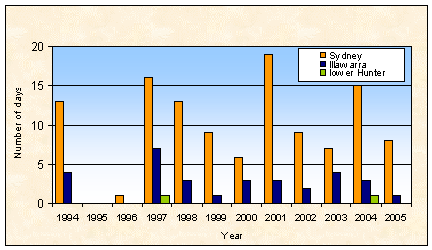
Figure 2: Number of days exceeding the NEPM standard for one-hour ozone concentration in the Greater Metropolitan Region, 1994–2005
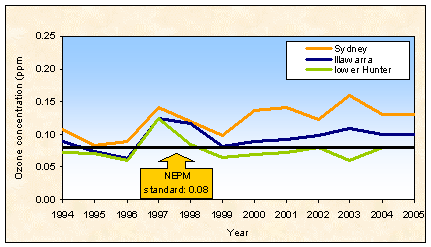
Figure 3: Annual maximum 4-hour ozone concentration in the Greater Metropolitan Region, 1994–2005
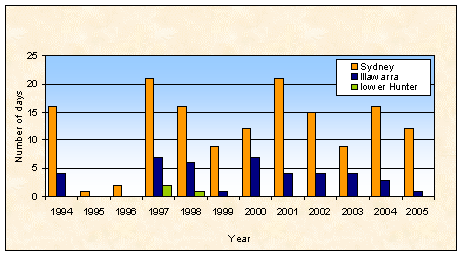
Figure 4: Number of days exceeding the NEPM standard for 4-hour ozone concentration in the Greater Metropolitan Region, 1994–2005
As was the case in 1998, exceedences of the national standard for particles are normally associated with extreme events such as bushfires in summer, hazard reduction burning in winter, and dust storms during severe droughts. The national goal of no more than five exceedences of the PM10 standard per annum has generally been met in Sydney (Figure 5). However, in years with significant bushfire activity or dust storms such as 2002 and 2003, many sites in the Greater Metropolitan Region recorded more than the five allowable exceedences (Figure 6).
Back to top
PM2.5 levels in NSW are generally below the Air NEPM advisory reporting standard established for a 24-hour level but are currently above the annual reporting level (Figure 7). Continuing drought across NSW and associated extreme events such as bushfires, hazard reduction burns and dust storms have accounted for a number of exceedences. Annual average PM2.5 levels were slightly lower in the Lower Hunter and the Illawarra, but were still at or above the annual advisory reporting standard.
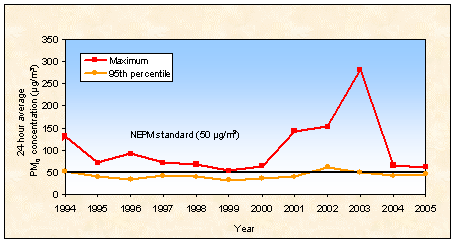
Figure 5: 24-hour PM10 concentration in the Sydney Region, 1994–2005
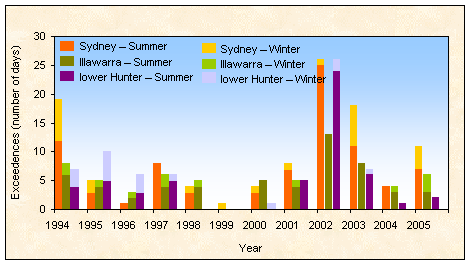
Figure 6: Number of days exceeding the NEPM 24-hour standard for PM10 in the Greater Metropolitan Region, 1994–2005
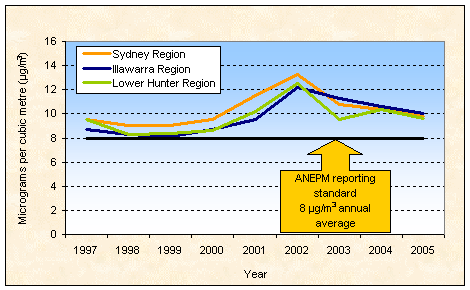
Figure 7: Annual average PM2.5 concentrations in the Greater Metropolitan Region, 1997–2005
Air toxics
Action for Air included a commitment to undertake a monitoring program for air toxics. From 1996 until 2001, DEC monitored air toxics at sites in the Greater Metropolitan Region and some regional centres. The study examined dioxins, organic compounds, polycyclic aromatic hydrocarbons and heavy metals, and found that ambient levels of most air toxics in NSW were low and well below current international standards and benchmarks.
Back to top
The levels of dioxins, a compound that remains in the environment for a long time, are very low, indicating that Government programs to reduce dioxin emissions have been effective.
Similarly, levels of benzene, xylenes and toluene, substances mostly produced by motor vehicles, were generally low. The Air Toxics NEPM's Monitoring Investigation Levels for these pollutants were met at all sites. The introduction of a 1% limit on benzene in petrol nationally from mid 2006 will further reduce ambient benzene levels.
Nevertheless, benzene, formaldehyde and polycyclic aromatic hydrocarbons at some sites, as well as 1,3-butadiene, will need to be watched to ensure they remain at acceptable levels in the future.
The study also found that winter levels of polycyclic aromatic hydrocarbons in some country towns and parts of Sydney are at times higher than the Air Toxics NEPM's Monitoring Investigation Levels, primarily due to the use of solid fuel heaters, vehicle emissions and the topography of the areas.
Pollution sources
As well as reviewing monitored air quality data, changes to pollution levels can be inferred from inventory emissions data. In 2002, DEC updated its air emissions inventory for Sydney. The inventory estimates are based on a 1992 Metropolitan Air Quality Study inventory, projected to 2002 using such factors as population growth and energy use, and incorporating updated information on vehicles and kilometres travelled, where available.
Table 2 shows the contribution by sector of volatile organic compounds (VOCs) and oxides of nitrogen (NOx), the precursors to the formation of ozone, and particle emissions for the Sydney Region in 1992 and 2002. The relative contribution from motor vehicles of each pollutant has fallen over this period, and is expected to decline further over the next 10–15 years. Nevertheless, mobile sources remain the major source of air pollution in Sydney.
Back to top
| |
VOCs (%) |
NOx (%) |
Particles (%) |
|
1992 |
2002 |
1992 |
2002 |
1992 |
2002 |
|
Industry |
10 |
14 |
13 |
18 |
33 |
40 |
|
Mobile |
49 |
44 |
82 |
76 |
31 |
19 |
|
Commercial/domestic |
41 |
42 |
5 |
6 |
36 |
41 |
Table 2: Comparison of 1992 and 2002 Sydney Region emissions by source
What is also notable from Table 2 is the significant contribution made by the commercial/domestic sector – 42% of VOCs and 41% of particle emissions in 2002. The relative contribution of this sector is likely to increase as emissions from motor vehicles continue to fall.
Table 3 shows the contribution of pollutants by sector for the Greater Metropolitan Region for 1992 and 2002. Here industry is increasingly the largest source of NOx and particles. As in Sydney, the commercial/domestic sector is a major source of VOCs and the contribution of motor vehicles to air pollution, while still significant, has fallen.
DEC's new emissions inventory will provide current and more detailed information on the contribution of the various emissions sources for both Sydney and the Greater Metropolitan Region.
| |
VOCs (%) |
NOx (%) |
Particles (%) |
|
1992 |
2002 |
1992 |
2002 |
1992 |
2002 |
|
Industry |
10 |
12 |
51 |
60 |
68 |
72 |
|
Mobile |
49 |
42 |
46 |
37 |
16 |
12 |
|
Commercial/domestic |
41 |
46 |
3 |
3 |
16 |
16 |
Table 3: Comparison of 1992 and 2002 Greater Metropolitan Region emissions by source
Page last updated: 26 February 2011