Why map soils and landscapes?
We map soils and landscapes to understand:
- their attributes and distribution
- the processes by which they develop
- their capability and suitability for various uses
- what risks may be involved and how they can be safely addressed.
Soil information is important for both the direct users of land and soils and for more strategic purposes, such as planning, policy making and environmental protection. It is also important for the improvement of or adaptation to large-scale environmental problems such as climate change, soil erosion, acidification and dryland salinity.
Agriculture and food security is another important area where soil information matters, not only for human health and food security but for the health of the economy. In 2014–15, New South Wales delivered approximately $12.125 billion in agricultural production, all of which was reliant in some way on the soil. As an example, soil and landscape mapping provides the foundation for the mapping of New South Wales's best land and soils as biophysical strategic agricultural land.
Soil maps
To see the extent of soil mapping across New South Wales and to determine what is available for your area of interest, use the ‘Soil map index layer’ in the eSPADE spatial viewer. Click on each coloured area of the map to find out what is available and how to access it. eSPADE also provides direct, free and easy access to the vast majority of this information.
Alternatively, if you know the name and type of the product you wish to access, select it from one of the tabs below.
This statewide standard for soil mapping combines both previously published and new areas. It is based on catchment boundaries or other areas of state significance. Ongoing mapping is targeted at regions of New South Wales where soil and land information is vital for land use planning and infrastructure development.
These products provide an inventory of soil and landscape properties of their areas of coverage and identifies major soil and landscape qualities and constraints. They integrate soil and topographic features into single units with relatively uniform land management requirements. Soils are described using various classifications such as the Australian Soil Classification, Great Soil Group systems and Northcote.
Products in this series are:
This series provides an inventory of soil and landscape properties of an area and identifies major soil and landscape qualities and constraints. It integrates soil and topographic features into single units with relatively uniform land management requirements. Soils are described in terms of soil materials and using various classifications such as the Australian Soil Classification, Great Soil Group systems and Northcote.
The series provides maps that were intended to cover all of eastern and central New South Wales, based on standard 1:100,000 or 1:250,000 topographic sheets – 1:250,000 scale was used in areas of broad-acre agriculture, mainly in the sheep-wheat belt. The 1:100,000 scale was used in areas under intense land use pressure or change, such as coastal and urban/peri-urban areas and regions of intensive cropping.
Collection of Soil Landscape Series information ceased in 2005 and, in 2010, the last of 39 paired soil landscape maps were published.
Products in these series are as follows.
1:100 000 Soil Landscape Series
- Armidale
- Baan Baa (Liverpool Plains portion)
- Bega
- Blackville
- Braidwood
- Canberra
- Cobargo
- Coffs Harbour
- Cooma
- Curlewis
- Dorrigo
- Dungog
- Eden
- Gosford–Lake Macquarie
- Holbrook–Tallangatta
- Katoomba
- Kempsey-Korogoro Point
- Kiama
- Lismore–Ballina
- Macksville–Nambucca
- Michelago
- Murrurundi
- Murwillumbah–Tweed
- Narooma
- Newcastle
- Penrith
- Port Stephens
- St Albans
- Sydney
- Tamworth
- Wagga Wagga
- Wallerawang
- Wingham–Camden Haven
- Wollongong
- Woodburn
1:250 000 Soil Landscape Series
This broadscale mapping of the Western Division of New South Wales was carried out in the mid-1980s to delineate areas or groups of areas with recurring patterns of topography, soils and vegetation. The maps and associated report cover the entire division at 1:250,000 scale, and are available as digital map data plus an associated report.
Products in this series are:
This broadscale mapping of the Western Division of New South Wales was carried out in the mid-1980s to delineate areas or groups of areas with recurring patterns of topography, soils and vegetation. The maps and associated report cover the entire division at 1:250,000 scale and are available as digital map data plus an associated report.
Products in this series are:
The Hydrogeological landscape (HGL) concept provides a structure for the understanding of how salinity shows itself in the landscape and how differences in salinity are visible across the landscape. A HGL spatially defines areas of similar salt stores and pathways for salt movement. For more information, see hydrogeological landscapes.
We have synthesised the best land and soil information from across New South Wales into a series of statewide maps. These include dominant soil types (Australian Soil Classification and Great Soil Group), dominant Land and Soil Capability (LSC), dominant Inherent Soil Fertility, Hydrologic Soil Group, Data Confidence and Modelled soil properties.
We also have partial state coverage for Soil Regolith mapping.
You can access these maps through the Custom layers section of eSPADE under the category of statewide land and soil mapping.
-
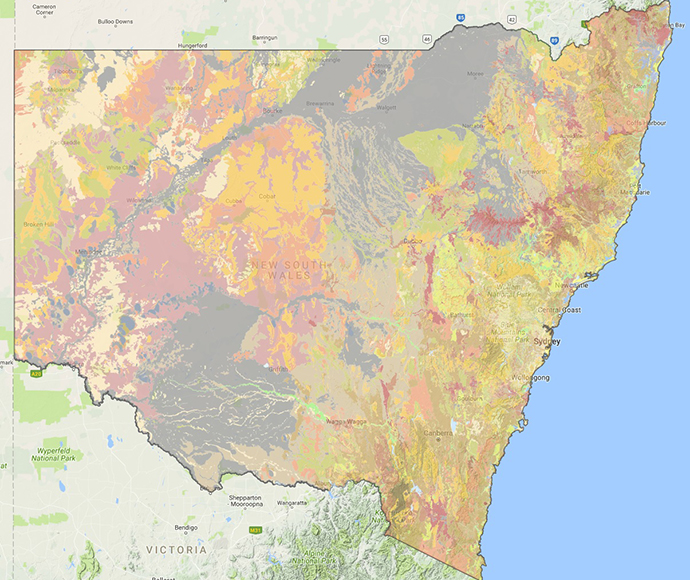
A statewide map illustrating the predominant Land and Soil Capability class is accessible on the eSPADE platform. -
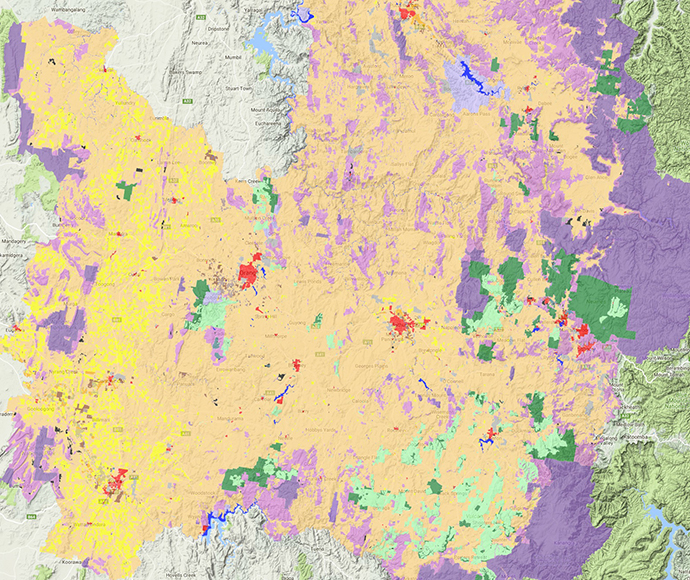
Part of the ALUM 18-class land use mapping for the Central Tablelands Local Land Services area is available on the eSPADE platform. -
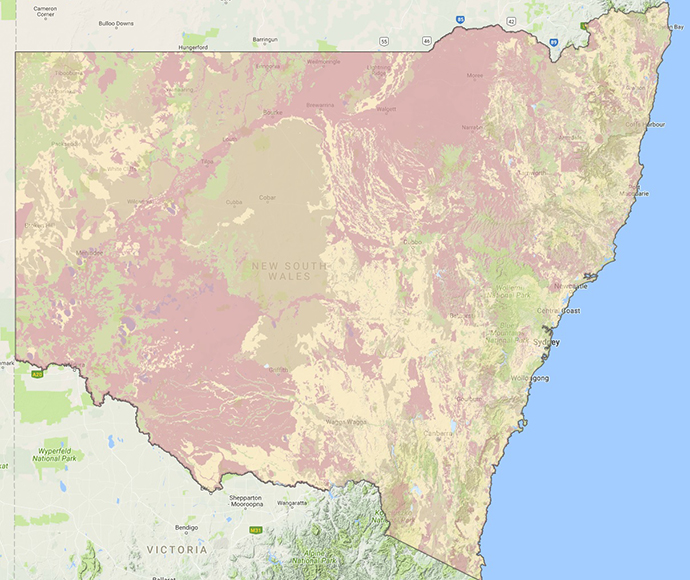
eSPADE map of the dominant Hydrologic Soil Group. -
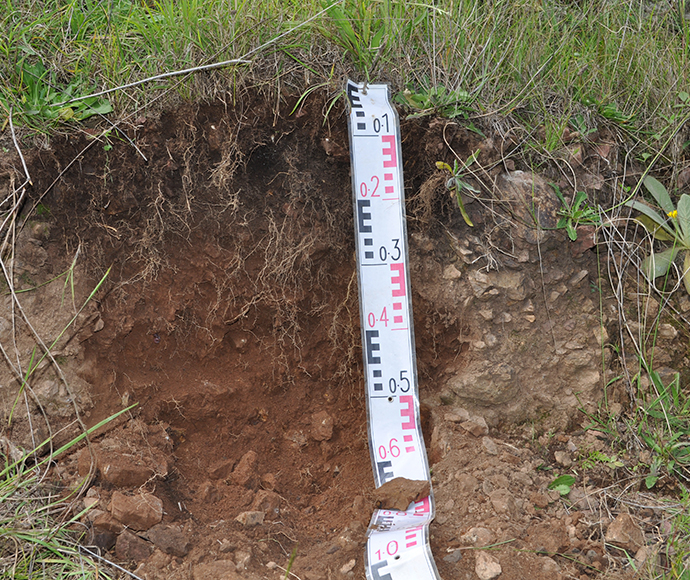
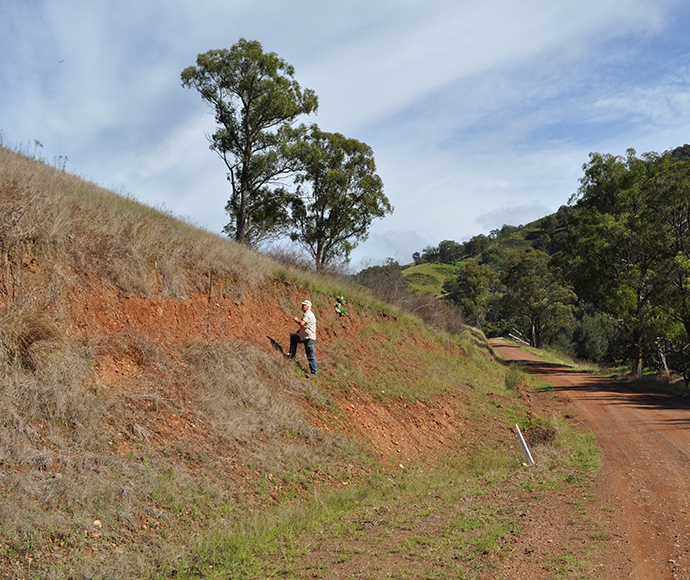
Mapping soils, like this Brown-Orthic Tenosol in the Hunter Valley, allows informed decisions on their management. -
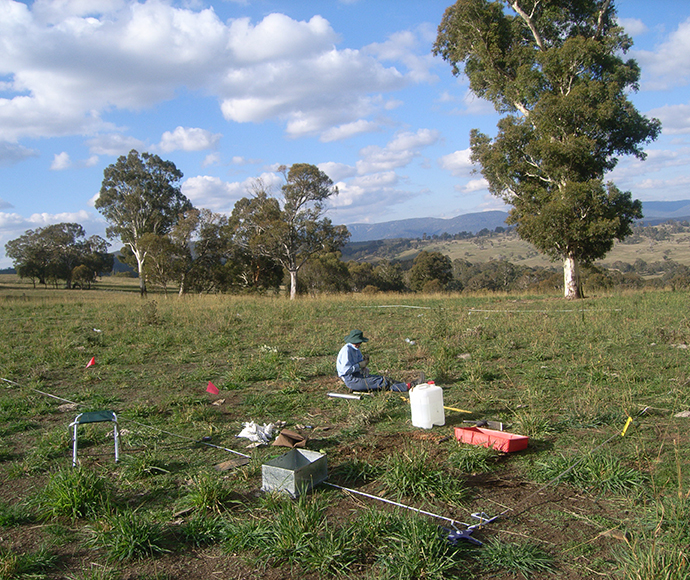
Monitoring land in the Murrumbidgee Catchment Management Authority. -
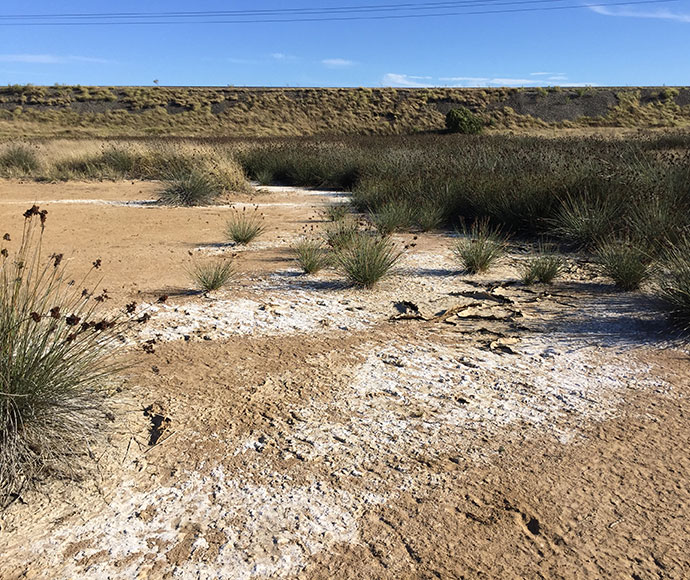
Roads and railways block groundwater flow, causing levels to rise. This leads to salt buildup in soil, killing plants that can't tolerate it. -
In-situ soil observations can map their distribution. This data is vital for better land management.
SoilTalk! news
Stay up to date on the latest news and events about landscapes, soils and systems in New South Wales.