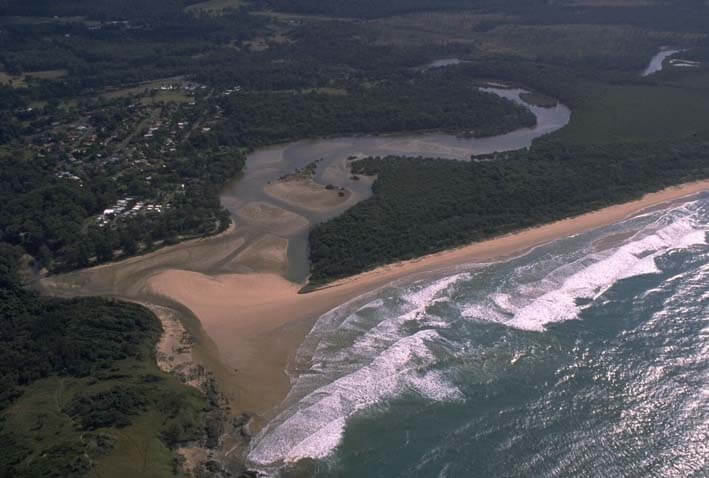
Moonee Creek estuary flows into the sea north of Coffs Harbour on the New South Wales north coast.
It is a barrier river estuary with an entrance predominantly open to the sea, but it is untrained and therefore often constricts tidal flow. Sugar Mill Creek is a tributary of the lower estuary and flows through one of the larger protected areas on this section of coastline.
Water quality report card
As part of our water quality monitoring program we assess the water quality and ecosystem health of an estuary using a range of relevant indicators. We sample a subset of the estuaries located between the Queensland border and Taree every 3 years. The most recent sampling in Moonee Creek was completed over the 2021–22 summer, when 2 sites were sampled on a monthly basis.
This report card represents 2 water quality indicators that we routinely measure: the amount of algae present and water clarity. Low levels of these 2 indicators equate with good water quality.
The report card shows the condition of the estuary was good with:
- algae abundance graded good (B)
- water clarity graded good (B)
- overall estuary health graded good (B).
Grades for algae, water clarity and overall are represented as:
- A – excellent
- B – good
- C – fair
- D – poor
- E – very poor.
Go to estuary report cards to find out what each grade means, read our sampling, data analysis and reporting protocols, and find out how we calculate these grades.
Coffs Harbour City Council, in collaboration with the University of New England’s EcoHealth program, has carried out detailed ecosystem health monitoring in Moonee Creek. The results of the monitoring program, including a detailed water quality report card, are available on the Coffs Harbour City Council website.
We have monitored water quality in Moonee Creek since 2009. This table shows the water quality grades for this estuary over that time.
| Year | Algae | Water clarity | Overall grade |
|---|---|---|---|
| 2009–10 | A | C | B |
| 2010–11 | A | A | A |
| 2012–13 | A | B | A |
| 2015–16 | A | B | B |
| 2018–19 | B | B | B |
Physical characteristics
| Estuary type | Barrier river |
|---|---|
| Latitude (ºS) | –30.21 |
| Longitude (ºE) | 153.16 |
| Catchment area (km2) | 41.1 |
| Estuary area (km2) | 0.4 |
| Estuary volume (ML) | 414.3 |
| Average depth (m) | 1.5 |
Notes: km2 = square kilometres; m = metres; ML = megalitres.
Water depth and survey data
Bathymetric and coastal topography data for this estuary are available in our data portal.
Land use
The catchment of Moonee Creek is highly disturbed. About 40% of land use has changed from forest to urban and rural residential/grazing areas. The lower estuary flows through Moonee Beach Nature Reserve, which remains forested. The inland section of the catchment which is managed by Forestry Corporation is also forested.
National and marine parks
- Moonee Creek is located within Moonee Beach Nature Reserve.
- Moonee Creek is part of the Solitary Islands Marine Park.
Community involvement
- Coffs Harbour Regional Landcare provides workshops and supports volunteer conservation and environmental work along the Coffs Coast.
- Bush regeneration work within the Coffs Coast Regional Park is coordinated through NSW National Parks and Wildlife Service Coffs Harbour bushcare and landcare. Twenty-two bushcare and landcare groups work in the Coffs Harbour area to protect and preserve this coastal area.
Local government management
Local councils manage estuaries within their area unless the estuary is attached to a marine park.
Moonee Creek is managed by Coffs Harbour City Council and Solitary Islands Marine Park. More information about this estuary, including an estuary management plan, can be found on the council’s Moonee Creek estuary webpage.
Threatened species
Threatened species, such as the southern myotis, are found within the Moonee Creek catchment. This native bat is also known as the large-footed myotis because it has disproportionately large feet.
Find out more about the biodiversity in our estuaries.