Summary
New South Wales’ climate in spring–summer 2019–20 was marked by:
- record high temperatures
- areas with lowest-on-record rainfall
- heatwaves
- strong westerly winds
- low humidity.
Dry phases of coinciding climate drivers intensified the warm, dry conditions experienced during these seasons.
The extreme weather and prolonged, intense drought combined, bringing dangerous bushfire conditions in the east and increased dust-storm activity across the State.
From July 2019 to March 2020, approximately 5,520,000 hectares of forest was burned in eastern New South Wales, compared with 5,566,557 hectares in the combined bushfire seasons from 1993–94 to 2018–19.
Extensive bushfire smoke and dust-storm activity led to record-setting air pollution levels during spring–summer 2019–20. More information on air quality during this period can be found in other sections of this Air Quality Statement.
Coinciding climate drivers intensifying warm, dry weather
The rainfall and temperature patterns over Australia during spring–summer 2019–20 were driven by the combined effects of dry phases in large-scale climate cycles, known as the positive phase in the Indian Ocean Dipole (IOD), the negative phase in the Southern Annular Mode (SAM) and a Sudden Stratospheric Warming (SSW).
- One of the strongest positive Indian Ocean Dipoles on record developed from mid-2019, typically bringing below-average rainfall in winter and spring, above-average temperatures, and increased fire risk for south-east Australia. The positive IOD phase was unusually long-lived, persisting into summer, rather than decaying at the end of spring.
- A persistent dry negative phase in the Southern Annual Mode coincided with a sudden stratospheric warming over the South Pole, producing an intense period of low rainfall and above-average temperatures, with consecutive heatwaves over parts of eastern Australia in late 2019.
A warm, dry spring and summer
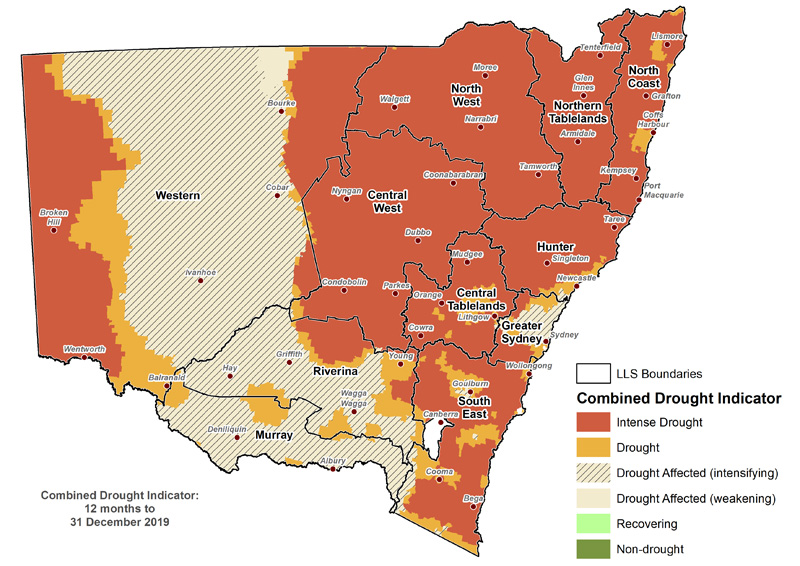
New South Wales experienced record high temperatures and persistent dry conditions, with heatwaves in November and 100% of the state drought-declared in December and January.
Spring 2019 – the sixth-driest spring on record
- Spring 2019 was the sixth driest on record, and the driest since 2002. Rainfall was 61% below the Statewide average and very much below average across more than half the state. North-eastern parts of the state observed the lowest rainfall on record.
- Daytime temperatures were more than 3°C above average in eastern parts of the State.
- Heatwave conditions in late November brought the warmest statewide average temperatures for the season, with 39.4°C on 21 November 2019. Locations in the south recorded their warmest spring temperatures on record during the heatwave.
- The State was 97.2% drought-declared in September, increasing to 99.9% drought-declared in November.
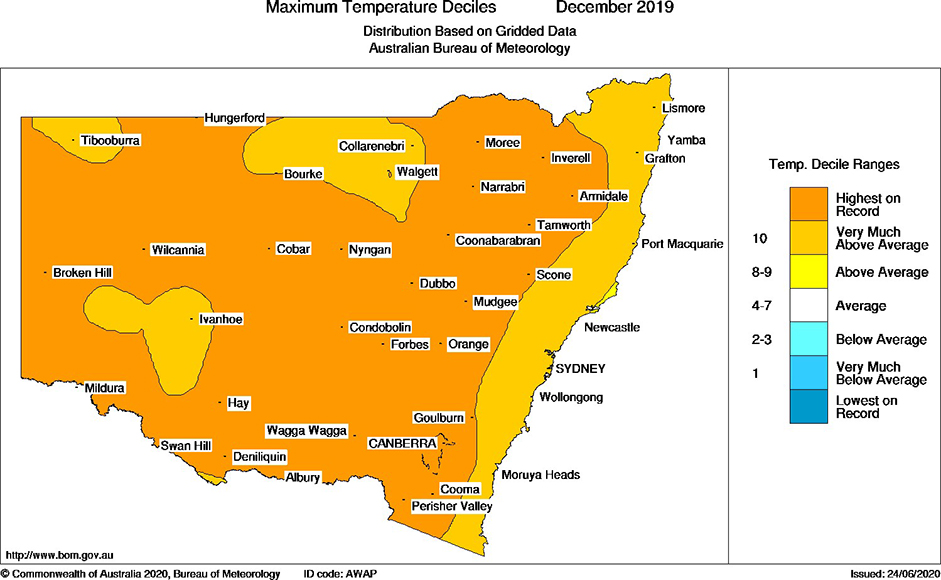
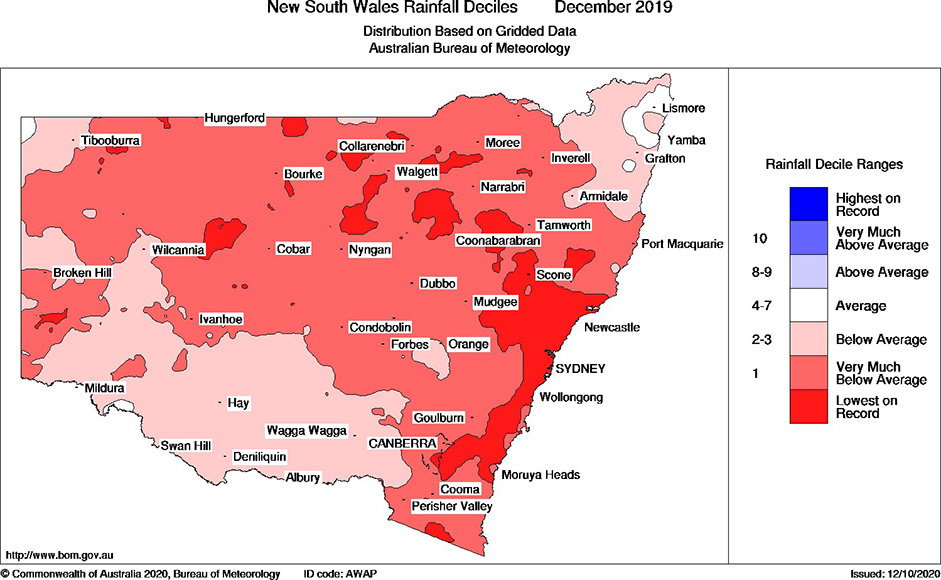
Summer 2019–20 – the warmest December on record
- Summer 2019–20 saw rainfall at 10% below average for the state, with large temporal and spatial variability. Rainfall during summer was above average in many coastal regions and below average in the west.
- Temperatures were above average throughout the State, reaching more than 2% above average. December 2019 was the warmest December on record. Australia’s area-averaged maximum temperature was 40°C, or higher, for 11 days in December. Previously, there has been only 11 such days since 1910, with seven in summer 2018–19 (Bureau of Meteorology Special Climate Statement 73).
- December 2019 was the second-driest December on record, with dry conditions continuing into most of January. Heavy coastal rain in late January, through February, brought relief to bushfire-affected coastal communities. Raised dust fell as dirty brown rain over Sydney on 24 January. However, below average rainfall persisted in the west.
- New South Wales was 100% drought-declared in December 2019 and January 2020, with most of the eastern half of the State in intense drought. Conditions improved in February 2020, with areas of intense drought decreasing substantially.
Dangerous fire weather
High temperatures, severe rainfall deficiencies, very low humidity and gusty winds combined to bring dangerous bushfire weather across eastern New South Wales during spring–summer 2019–20. Very dry fuel loads exacerbated the increased bushfire risk (Bureau of Meteorology Special Climate Statement 72 and Statement 73).
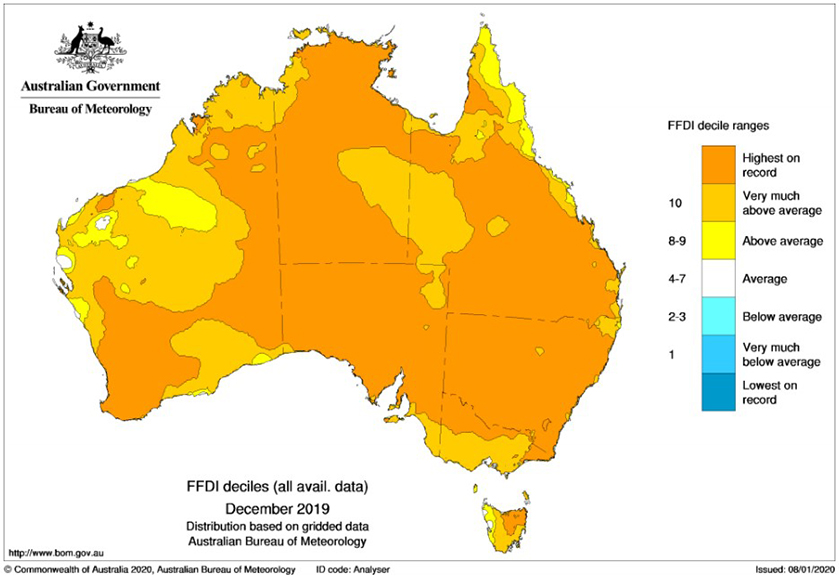
- The highest Forest Fire Danger Index (FFDI) levels, since records began in 1950, were observed in spring and summer 2019–20 over large parts of Australia.
- Catastrophic FFDI levels were observed in north-east parts of the state on 6 September 2019. This event marked the onset of numerous large bushfires in the NSW north-east ranges, which burned throughout spring and summer.
- North-east parts of the state recorded 21 days in the very high fire danger category in spring 2019 – the most on record (almost doubling the previous record of 11 days in spring 2002).
- Dangerous fire weather conditions continued into summer, with most of the State recording the highest accumulated FFDI levels on record in December 2019.
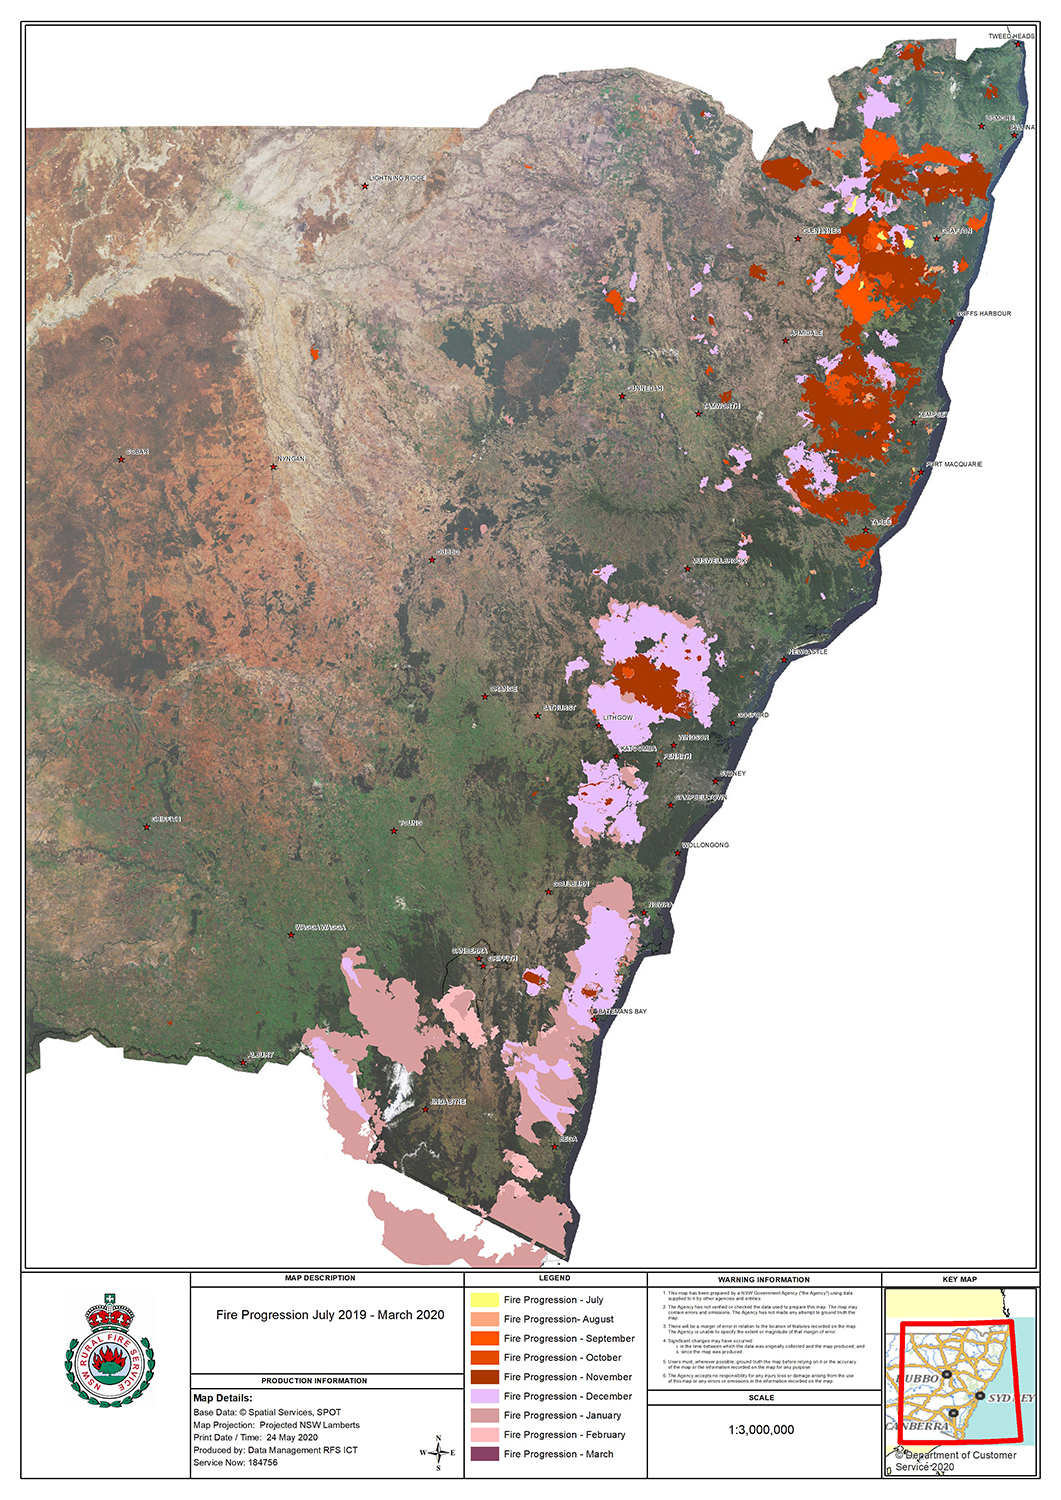
Extensive burnt areas
- Over 5.5 million hectares burned during the 2019–20 bushfire season, compared with 5,566,557 hectares in the combined bushfire seasons from 1993–94 to 2018–19 .
- 11,774 fires were recorded from July 2019 to March 2020, covering almost 7% of the State’s land area, with a fire perimeter over 26,600 kilometres .
- The NSW bushfire season 2019–20 started earlier than usual and ran for eight months, between 1 July 2019 and 31 March 2020. Fire activity spread from the north-east to south-east during July to October. The last fires were extinguished on 2 March 2020, after 240 consecutive days of active bush or grass fires. Fires were most active in December, with over 2,000 bush and grass fires recorded.
Intensified dust activity
Prolonged rainfall deficiency, loss of ground cover, and strong, gusty winds combined to intensify dust activity across New South Wales in spring and most of summer 2019–20. The NSW Rural Air Quality Monitoring Network (formerly the NSW Community DustWatch network) recorded the highest levels of dust activity since the DustWatch network began in 2005.
- Rainfall for the 3 years 2017–2019 was the lowest on record Statewide. Rainfall deficiencies in northern parts of the state for the 2 years 2018–19 were 52% below average, breaking records originally set during the Federation Drought in 1990–1902.
- Groundcover was the lowest on Statewide records in western New South Wales in September and in many regions by October, with a further rapid decline in November. The lowest groundcover on record was observed across central parts of the State in December, before improving in January.
- Wind strengths were higher than average in September and November.
- Dust activity set new records in spring, with September 2019 recording more dust-haze hours than in September 2009, the year of the Red Dawn dust storm. October 2019 was the dustiest October month on record. November 2019 was the dustiest of any month on record. January 2020 brought a doubling of dust activity, compared with December 2019.
- Many widespread dust storms elevated particle levels across very large parts of the state during spring-summer 2019–20. Case studies of smoke and dust storms can be found in the Focus areas of this Air Quality Statement.
Impact on air quality
New South Wales experienced record-setting air pollution during spring–summer 2019–20, primarily particle pollution caused by bushfire smoke and dust. The NSW air quality monitoring network recorded particle pollution levels many times higher than national standards. Thick smoke across eastern parts of the state reduced visibility to the lowest levels on record, and for the longest periods on record (since the expansion of the air quality monitoring network in 1994). A summary of air pollution in spring–summer 2019–20 is given in other sections of this Air Quality Statement.