The National Environment Protection Measure for Ambient Air Quality (the AAQ NEPM) sets national standards for the 6 key air pollutants that most Australians are exposed to.
These pollutants include:
- particles as PM10, or particulate matter that is 10 microns or less in diameter
- particles as PM2.5, or particulate matter that is 2.5 microns or less in diameter
- ozone
- sulfur dioxide
- nitrogen dioxide
- carbon monoxide
- lead.
Pollution levels
When the level of these air pollutants is higher than its national standard, we call this an exceedance. Exceedances can be caused by events that are classed as:
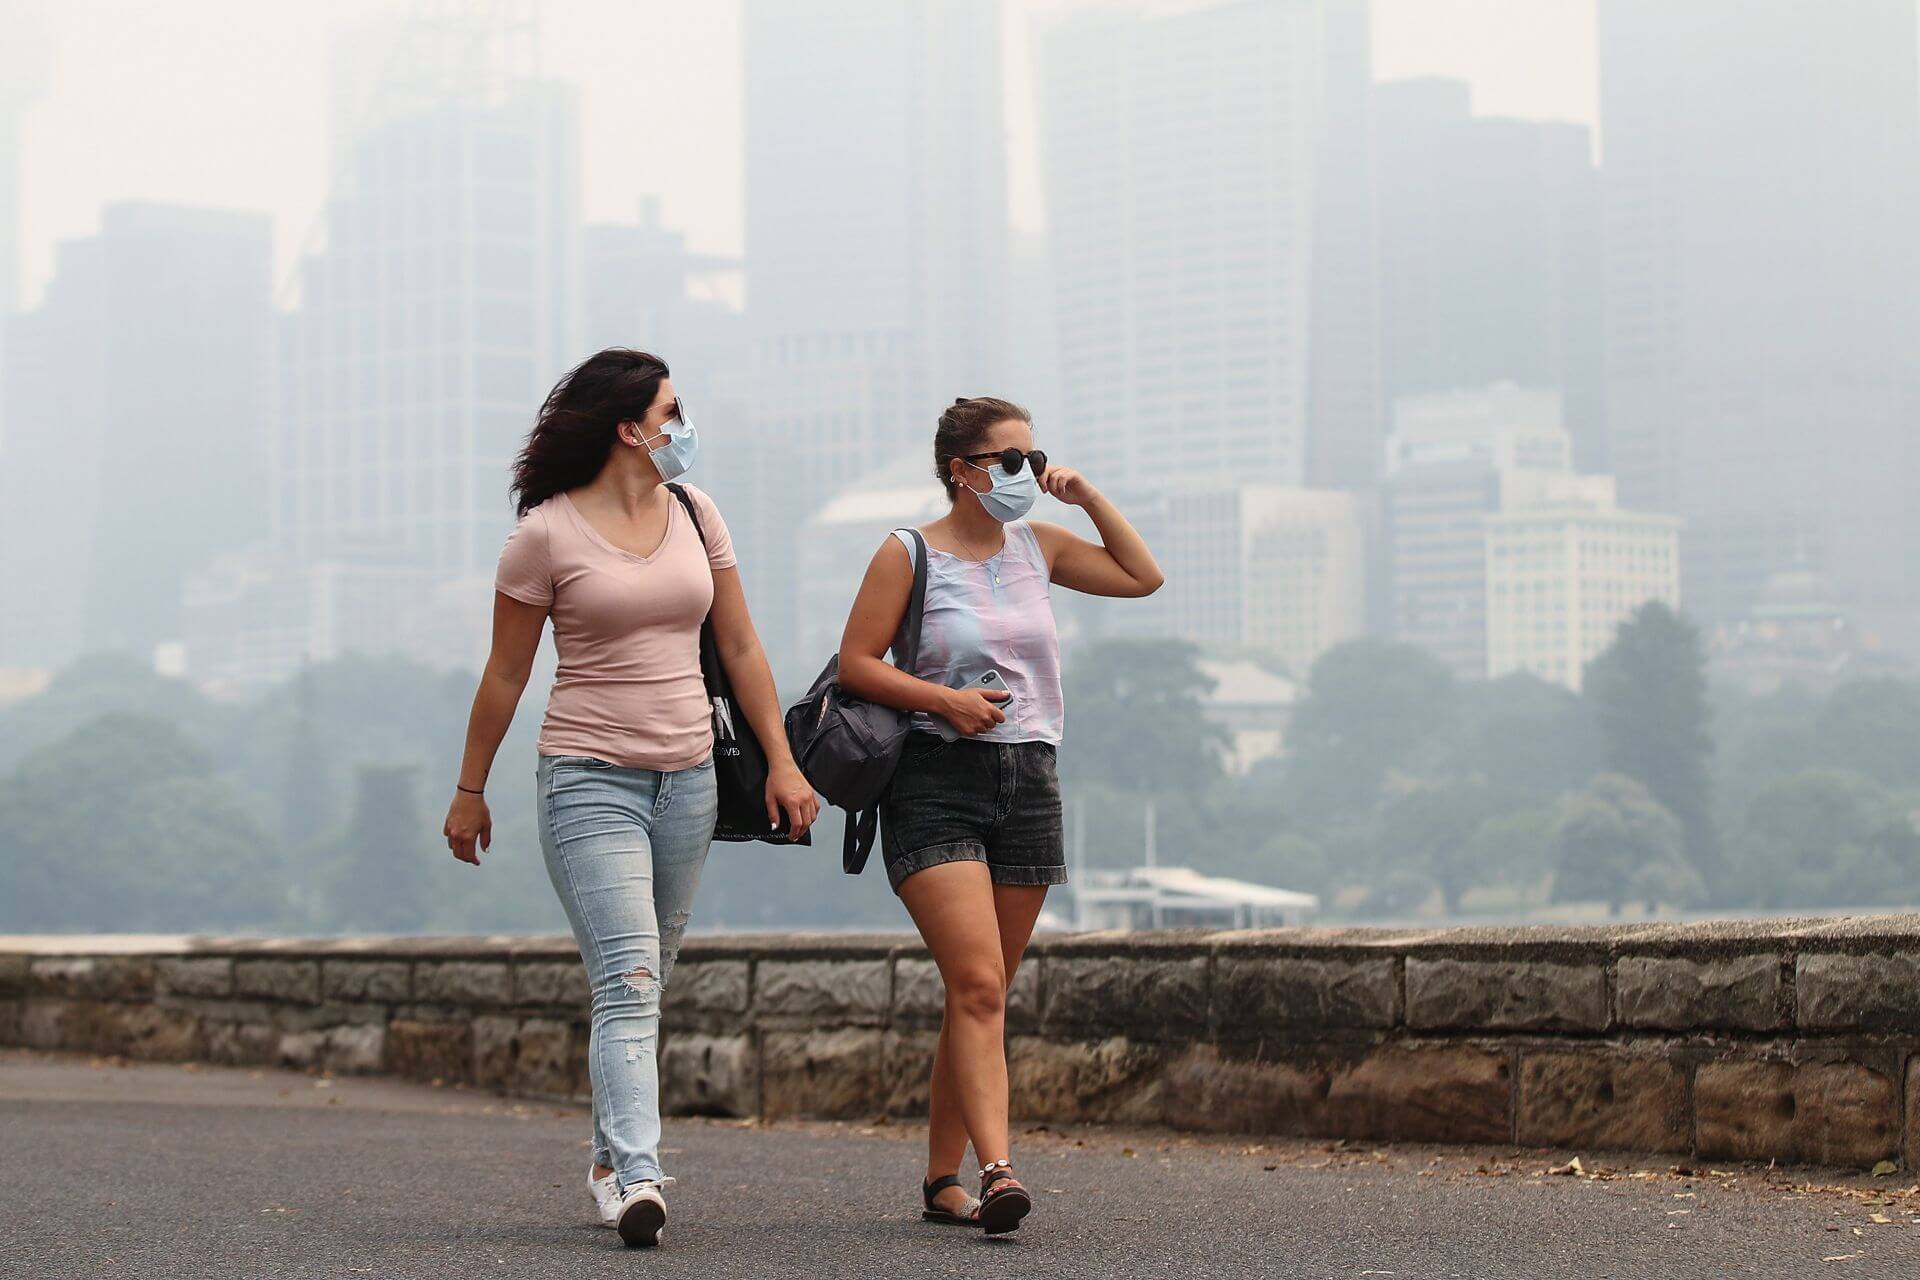
- exceptional, such as large dust storms or smoke from bushfires and hazard reduction burning
- non-exceptional, such as smoke from wood heaters, emissions from burning fossil fuels, or dust from mining operations.
Each year, we compare air pollution data from the NSW Government’s network of compliant air quality monitoring stations with national standards. We produce an annual air quality statement that summarises air pollution exceedance days in the year and notes where, when and why they occurred.
National standard review
National standards are reviewed and adjusted based on the latest scientific evidence about the health impacts of air pollution.
The National Environment Protection Council varied the national standards for ozone, nitrogen dioxide and sulfur dioxide in 2021. The revised standards were legislated on 18 May 2021 (Schedule 2).
There are no maximum allowable exceedances for any pollutants other than on exceptional event days.
Current national standards for key air pollutants in Australia
| Pollutant | Period | National standard |
|---|---|---|
| Particles as PM10 | Daily average | 50 micrograms per cubic metre (µg/m3) |
| Particles as PM10 | Yearly average | 25 micrograms per cubic metre (µg/m3) |
| Particles as PM2.5 | Daily average | 25 micrograms per cubic metre (µg/m3) |
| Particles as PM2.5 | Yearly average | 8 micrograms per cubic metre (µg/m3) |
| Ozone | 8-hour rolling average | 6.5 parts per hundred million (pphm) in ambient air |
| Sulfur dioxide | One-hour average | 7.5 parts per hundred million (pphm) |
| Sulfur dioxide | Daily average | 2 parts per hundred million (pphm) |
| Nitrogen dioxide | One-hour average | 8 parts per hundred million (pphm) |
| Nitrogen dioxide | Daily average | 1.5 parts per hundred million (pphm) |
| Carbon monoxide | 8-hour rolling average | 9 parts per million (ppm) |
| Lead | Yearly average | 0.50 micrograms per cubic metre (µg/m3) |
Note: Mn = megametres; NEPH = nephelometry or the measure of light scattering due to particles in the air. This standard measure for visibility is set by the NSW Department of Climate Change, Energy, the Environment and Water.
Visibility
Nephelometry values (NEPH) measure the scattering of light by airborne particles and are used as an indicator of atmospheric visibility. Higher values indicate hazier conditions and poorer visibility. The guideline value below indicates level at which haze may become noticeable.
| Metric | Period | Value |
|---|---|---|
| Visibility (NEPH) | One-hour average | 3 x 10⁻⁴ per metre (300 Mm⁻¹) |
Note: Mm⁻¹ = inverse megametres, a unit used to quantify light extinction and visibility reduction caused by airborne particles