The Hunter River estuary is situated on the Hunter coast of New South Wales. It is a large barrier river estuary and contains the extensive internationally recognised Hunter estuary wetlands.
The Hunter River begins in the Barrington Tops and flows around 460 kilometres to its entrance at Newcastle. It drains the third-largest coastal catchment in New South Wales. The Hunter River is a major hub of industrial and export activity.
Water quality report card
As part of our water quality monitoring program we assess the water quality and ecosystem health of an estuary using a range of relevant indicators. We sample a subset of the estuaries located between Taree and Wollongong every 3 years. The most recent sampling in the Hunter River was completed over the 2022–23 summer, when 2 sites were sampled on a monthly basis.
This report card represents 2 water quality indicators that we routinely measure: the amount of algae present and water clarity. Low levels of these 2 indicators equate with good water quality. The numerical scores for these 2 indicators are averaged to give the overall grade.
Algae
Water clarity
Overall grade
The report card shows the condition of the estuary was poor with:
- algae abundance graded very poor (E)
- water clarity graded fair (C)
- overall estuary health graded poor (D).
Grades for algae, water clarity and overall are represented as:
- A – excellent
- B – good
- C – fair
- D – poor
- E – very poor.
Go to estuary report cards to find out what each grade means, read our sampling, data analysis and reporting protocols, and find out how we calculate these grades.
We have monitored water quality in the Hunter River since 2010. This table shows the water quality grades for this estuary over that time.
| Year | Algae | Water clarity | Overall grade |
|---|---|---|---|
| 2022–23 | E | C | D |
| 2019–20 | B | C | C |
| 2016–17 | C | C | C |
| 2013–14 | B | D | C |
| 2010–11 | D | E | D |
Physical characteristics
| Estuary type | Barrier river |
|---|---|
| Latitude | –32.91 (ºS) |
| Longitude | 151.8 (ºE) |
| Catchment area | 21,367 km2 |
| Estuary area | 47 km2 |
| Estuary volume | 137,089.4 ML |
| Average depth | 3.3 m |
Tidal exchange volume
Tidal exchange volume or tidal prism data is available for this estuary. This tidal prism was measured in 1998.
| Tide state | Flow (ML) | Local tidal range (m) | Sydney Harbour tidal range (m) |
|---|---|---|---|
| Ebb flow | 29,200 | 1.42 | 1.36 |
| Flood flow | 26,800 | 1.41 | 1.37 |
Notes: km2 = square kilometres; m = metres; m3 = cubic metres; ML = megalitres.
Water depth and survey data
Bathymetric and coastal topography data for this estuary are available in our data portal.
Land use
The Hunter River catchment has been heavily disturbed, with most of the middle and lower catchment having been cleared. Less than 40% of the catchment remains forested, a lot of which is protected in the western sections of the catchment. The dominant land use within the catchment is beef and dairy production. Mining, industry and urban areas make up the remainder of land use.
Water use
Find out about water use in the Hunter catchment, including information about major water users, real-time flow data, and environmental and water sharing plans.
National and marine parks
- Wollemi National Park is the largest conservation area in this catchment.
- This estuary does not flow into a marine park
Community involvement
The Hunter Region Landcare Network provide resources and links to local landcare groups within the Hunter River region. The network helps coordinate volunteers who work to manage and protect the local natural environment.
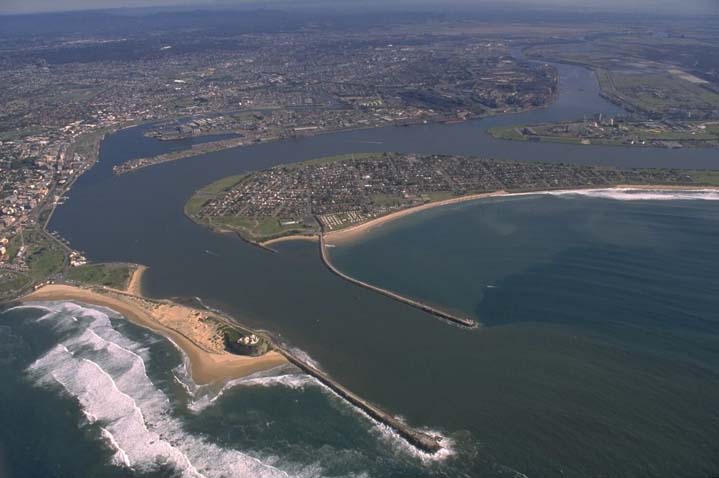
Aerial view of Hunter River
Local government management
Local councils manage estuaries within their area. Where an estuary is attached to a marine park, marine park management teams are responsible for ensuring compliance with marine park zoning.
Newcastle City Council manages this estuary. More information about the Hunter River estuary can be found on the council’s Hunter River webpage.
Threatened species
The Hunter River estuary provides important feeding grounds for the endangered curlew sandpiper during its non-breeding period. It also provide habitat for the endangered green and golden bell frog.
Find out more about the biodiversity in our estuaries.