It is a powerful information resource benefitting landholders, environmental planners and local communities by showing the extent of native plant communities in New South Wales.
What is the State Vegetation Type Map?
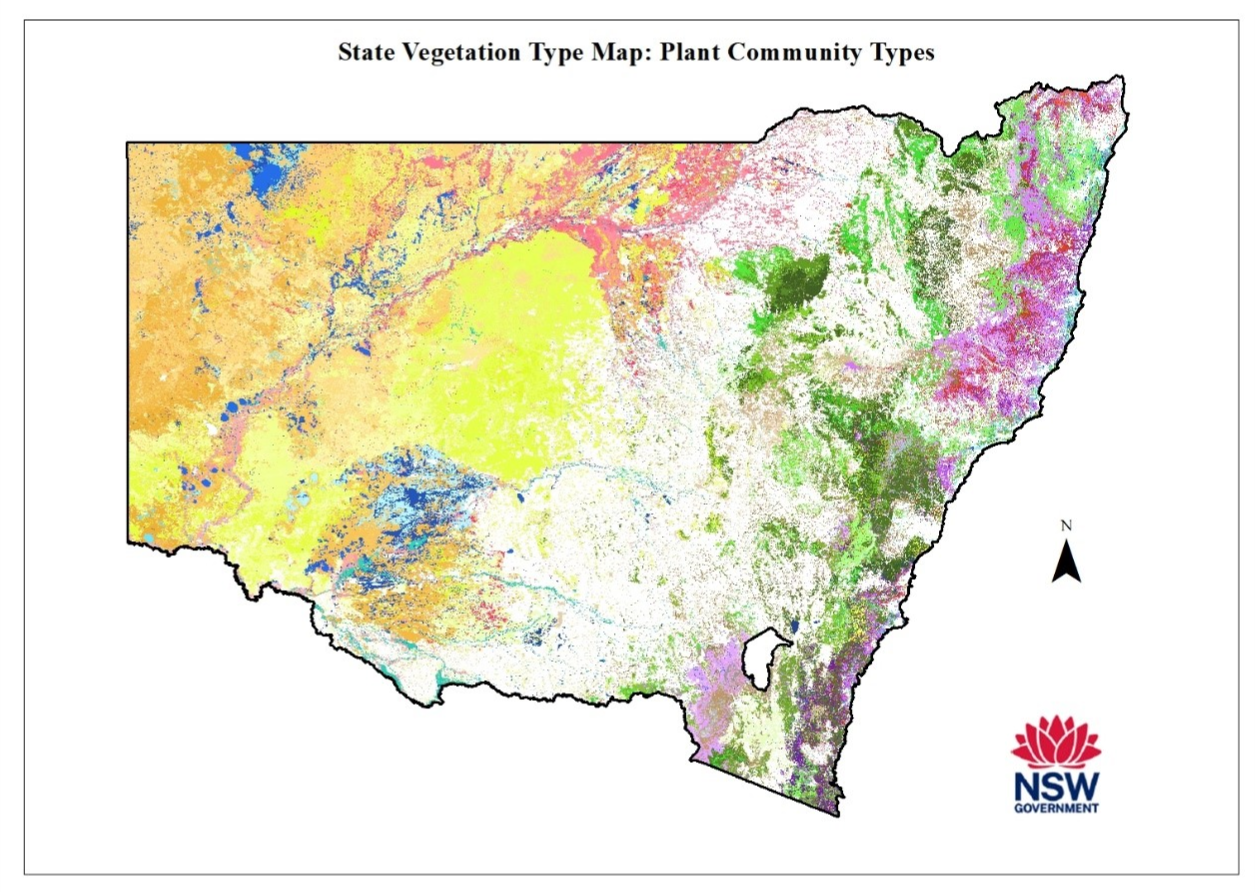
The State Vegetation Type Map (SVTM) is a regional-scale map of the 3 levels of the NSW vegetation classification hierarchy.
It maps the distribution of each plant community type (PCT), vegetation class and vegetation formation across all tenures in New South Wales.
There are 2 separate map products:
- The State Vegetation Type Map extant map shows the distribution of the plant community types within the limits of present-day native vegetation cover across New South Wales.
- The State Vegetation Type Map pre-clearing map displays the likely distribution of plant community types before the loss of native vegetation cover. The pre-clearing map for central New South Wales is currently in preparation.
The State Vegetation Type Map helps government, business and the community to understand the composition and relative importance of native vegetation in their local area. It helps decision makers to better recognise the different groupings of native vegetation in their area and make more informed land management or conservation investment decisions.
By using the map, land-use planning and on-ground actions are better matched to the characteristics of the vegetation being managed. For example, it facilitates selection of the best native species mix to rehabilitate disturbed areas.
Watch the video

How do I get the map?
The State Vegetation Type Map is available from a number of sources. Each source offers access to the same maps but with different features depending on viewing and data needs.
The Trees Near Me NSW app provides quick access to view the map using a mobile device or desktop. Download the app for Google Play or the App Store from the Trees Near Me NSW app site.
You can also access vegetation information through the Restore Trees NSW app.
Watch the video: Introduction to the Trees Near Me NSW app.
The map can also be viewed on the SEED portal (Sharing and Enabling Environmental Data).
The SEED portal also gives access to the web map service and the ability to download map products as a GIS package.
Mapping methods overview
The State Vegetation Type Map is created and maintained using a method for regional-scale mapping of plant community types. The State Vegetation Type Map method can be found in the NSW State Vegetation Type Map technical notes.
The method uses on-ground surveys, aerial and satellite photograph interpretation and landscape models to map the most likely plant community types. While much of the map is regional-scale information, some fine-scale mapping has been selectively included.
We will include further fine-scale mapping in the future, as well as updates and revisions as better information becomes available. Systematic validation of the maps is progressively undertaken by independent ecologists and reported as part of the annual update.
Watch the videos


How reliable are regional-scale vegetation maps?
The map's overall spatial precision (line work) is about 5 metres. Spatial precision is facilitated by computer-generated feature recognition software.
Aerial photographic interpretation is prepared between 1:10000 and 1:20000 scale.
Attribution accuracy (plant community type) depends on the number of vegetation classes being mapped and the quality and number of surveys available for each plant community type.
Some plant community types can be mapped with high accuracy, reliably representing their distribution. Others have very little survey information available, so accuracy of the map will be limited. Some plant community types have so little survey data that they cannot be mapped at a regional scale.
We are validating the State Vegetation Type Map iteratively as resources become available. Our general aim is to ensure that it averages at least 70% accuracy on the ground.
Keeping maps current
The State Vegetation Type Map is designed to be routinely updated as better information becomes available. Annual map updates are coordinated with the maintenance of plant community types. Visit Integrated BioNet Vegetation Data for New South Wales.
Anyone can contribute to ongoing improvement of the map by suggesting new or better information through the Provide feedback button in SEED. Watch a video on enhanced feedback to see how.
Older regional maps were incorporated into the new single statewide State Vegetation Type Map at release C1.1M1.0 (June 2022). As older regional coverages are superseded by the map and use declines, they will be progressively removed from SEED.
The first annual update of the State Vegetation Type Map (C2.0.M2.0) was released in December 2023. Changes to mapping are detailed in the report State Vegetation Type Map release C2.0M2.0.
The second annual update (C2.0.M2.1) was released in November 2024. Changes to mapping are detailed in the report State Vegetation Type Map release C2.0M2.1.
A log of State Vegetation Type Map releases is available.
Plant community type clearing loss estimates
Information about the clearing loss of each plant community type (plant community type percentage cleared) is important for understanding how much native vegetation remains in the landscape. The data quantifies the amount of loss, which informs a range of decision-making processes for conservation planning, threatened ecological communities and threatened species protection, the Biodiversity Offsets Scheme, and the biodiversity values map.
The Eastern NSW plant community type percentage cleared calculation technical notes provide detailed information on the calculation of plant community type percentage cleared values for eastern New South Wales plant community types. The document presents 2 sets of data:
- Raw State Vegetation Type Map plant community type percentage cleared, calculated by comparing the pre-clearing plant community type map and the extant plant community type map.
- Condition weighted State Vegetation Type Map plant community type percentage cleared, which integrates a condition layer into the calculation. This is the plant community type percentage cleared value held in BioNet Vegetation Classification and applicable to the Biodiversity Offsets Scheme. These figures represent land-use impact on biodiversity at a landscape scale.
The condition layer is available on SEED.
Data relating to the plant community type percentage cleared values are visible in the Extent tab of the plant community type user interface in the BioNet Vegetation Classification application.
The 'condition weighted State Vegetation Type Map plant community type percentage cleared' value is provided for quantitative plant community types. In eastern New South Wales, plant community type percentage cleared values are calculated from pre-clearing and extant mapping.
In central and western New South Wales, the plant community type percentage cleared values were derived by subject matter experts based on first-hand knowledge of the vegetation communities, existing vegetation reports and mapping products. Often, only a plant community type percentage cleared estimate is available.
How do we make sure the maps are prepared in a scientifically rigorous way?
The department has published Our commitment to best practice science. Peer review and expert guidance are a key requirement of the statement.
Further detailed information about mapping methods is available in the NSW State Vegetation Type Map: technical notes.
An independent group of highly regarded and experienced scientists from across Australia and New Zealand were invited to advise the department during the development of the State Vegetation Type Map. The peer review group reviewed methods as well as provided directions for improvements.
The methods we use are supported by published scientific literature before use.
Independent ecologists collect validation survey data used to validate the State Vegetation Type Map.
Survey sites
The mapping team acquires survey site data from established BioNet records such as Systematic Flora Survey data. The mapping team may also conduct surveys to collect floristic site data for upload into BioNet and other landscape-based information that is essential to remote sensing interpretation.
Segmentation
We use sophisticated feature recognition software, originally developed for medical imaging technology, to analyse satellite imagery and aerial photography to delineate small patches of vegetation that have the same visual characteristics.
This technique is generally known as segmentation because the process divides the image into segments and then automatically draws polygons or lines around each of these areas of similarity according to a defined set of rules.
It effectively replicates what humans do when interpreting imagery, but saves considerable time and cost compared with manually drawing lines.
The whole image is segmented; including non-vegetation features such as water bodies, infrastructure and buildings so that we can construct a pre-clearing native vegetation map as well.
Structural groups
Next, remote sensing experts use their skills and experience to assign each of the segments to a vegetation group called vegetation photo patterns. Patterns include multiple categories that are observable by aerial photographic interpretation: for example, Dry Sclerophyll Forest, Coastal Floodplain Forest, Heathland, Rainforest or Wetland.
We use a range of clues to help identify the patterns, including survey sites, previous mapping and topographic layers like geology and altitude.
Patterns are created for the whole landscape so we can create a pre-clearing plant community type map.
Incorporating detailed mapping
The state vegetation type map has been designed to readily incorporate new information without the need for whole-scale remapping. In fact, the map already includes some existing mapping. These sources have used the same or equivalent vegetation types but may have mapped to higher levels of detail or had more intensive field verification.
Fine-scale vegetation mapping is often undertaken independently and for very specific purposes, including management of threatened ecological communities. We can help other agencies, local government or private consultants to maximise their compatibility for incorporation into the state vegetation type map.
Computer modelling
We use sophisticated computer models to assign each plant community type into an appropriate landscape pattern. The models identify the mostly likely plant community types within each pattern.
We also ensure that our models undergo rigorous internal validation and cross-checking and we regularly set aside a pool of samples to independently test the model performance.
The extant and pre-clearing maps
We use the NSW native vegetation extent layer to mask out areas that are not native vegetation. This provides us with the extant map of plant community types.
Natural native grasslands are added back into the extant map using another layer called the seasonal disturbance image. This helps us locate natural grasslands which cannot be reliably mapped using aerial photographic interpretation – unlike most other pattern types.
Derived communities and areas that are not native vegetation, such as pine forests, plantations, weeds, open water, agricultural paddocks, built infrastructure, urban areas, roads, dams and exposed earth are excluded from the extant map.
Expert review
Experienced ecologists review the draft plant community type map to check for any issues like ecological inconsistency, gross errors, spatial inconsistencies and discontinuities. Errors and omission are manually corrected by expert landscape ecologists.
More technical detail about how the map is created is provided by the NSW State vegetation type map: technical notes.
Technical documents
- NSW State Vegetation Type Map technical notes 2024
- NSW State Vegetation Type Map technical notes 2023
- NSW State Vegetation Type Map technical notes 2022
- Eastern NSW plant community type percent cleared calculation technical notes 2023
- Eastern NSW plant community type percentage cleared calculation technical notes 2022