2021 Non woody figures have been updated on completion of 2022 analysis
The 2021 NSW Vegetation Clearing report figures for non woody vegetation clearing have now been updated and included in the 2022 NSW vegetation clearing report.
The 2021 finalised figures for non woody vegetation clearing show there was a 15% decrease in non woody vegetation clearing when compared to 2020. This is the first instance of reduction in non woody clearing since 2018.
Non woody vegetation clearing on Category 2 regulated land in 2021 decreased by 13% when compared with 2020 figures.
Non woody figures for 2021 show 62% of all vegetation clearing on category 2 regulated land was considered unallocated. This is a decrease from unallocated clearing occurring between 2018 and 2020 (68%).
The new confirmed figures are captured in the 2022 reporting period and are not included in the graphics below.
The NSW Vegetation clearing report describes woody and non woody vegetation clearing which occurred from 2018 to 2021 across the state and on Category 2 regulated land. Category 2 Regulated land is land subject to Part 5A of the Local Land Services Act 2013 (LLS Act), which came into effect in August 2017.
Statewide woody vegetation clearing in 2021 has decreased by 7% since 2020. However, woody vegetation clearing on Category 2 regulated land has increased by 6% since 2020.
Statewide non woody vegetation clearing in 2020 (confirmed in 2021) shows an increase of 9% compared with 2019. Non woody vegetation clearing on Category 2 regulated land saw a similar increase. Non woody vegetation clearing figures for 2021 are preliminary and will be confirmed in the next annual report. See How vegetation clearing is captured for more information.
The Statewide Landcover and Tree Study uses Sentinel 2 satellite imagery and expert image interpreters to analyse and report on vegetation clearing. See How vegetation clearing is captured for more information. All NSW vegetation clearing data within this report is available to download.
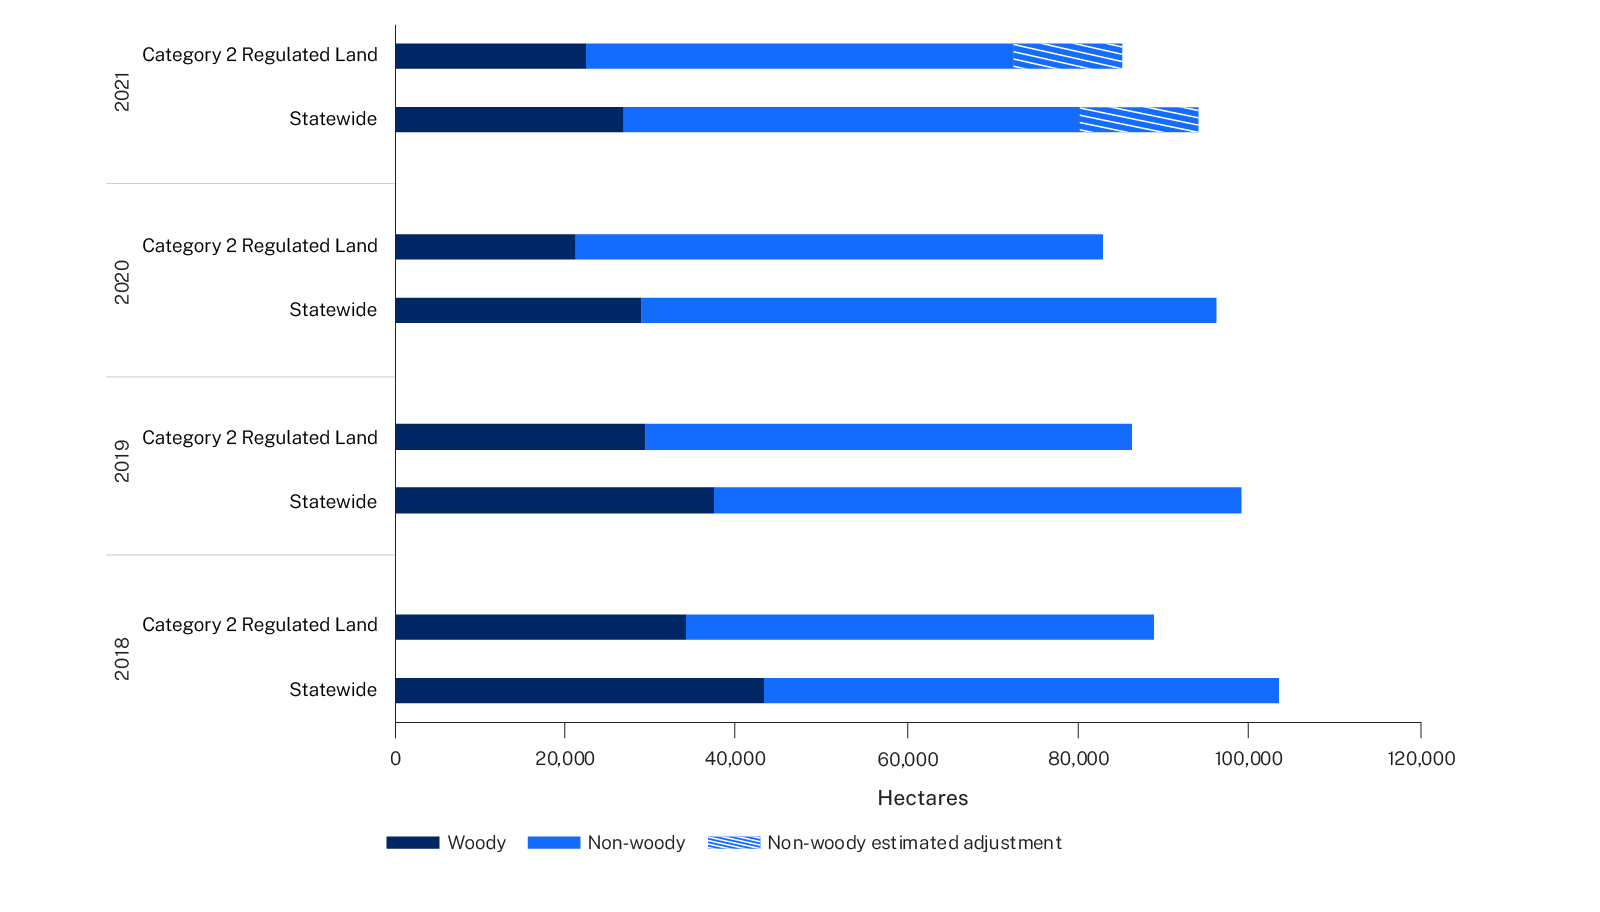
Figure 1: Woody and non woody vegetation clearing statewide and on Category 2 regulated land
How is vegetation clearing captured and reported?
This report includes the clearing of both woody and non woody vegetation structural types:
- Woody vegetation is plants (including saplings or shrubs) that produce wood as their primary structural tissue. It is typically trees, shrubs or woody vines and is usually perennial. The clearing of woody vegetation is detectable in satellite imagery.
- Non woody vegetation includes understorey plants and groundcover plants (herbaceous vegetation like grasses, herbs and forbs) that have been relatively undisturbed since 1990. The clearing of non woody vegetation is detected using a combination of visual cues and time series analysis of remotely sensed images.
The area of vegetation cleared is detected through automated and manual interpretation of differences between Sentinel-2 satellite images captured during summer each year. Satellite images are selected as close as possible to 1 January each year. The images must have a clear view of the ground and not be impacted by smoke or cloud cover.
Image interpreters examine the imagery to identify and confirm clearing events. They then assign a replacement landcover class that is indicative of the intended purpose of the change. The broad landcover classes are clearing for agriculture, forestry and infrastructure activities and are reported in the Statewide vegetation clearing by landcover class below.
Clearing figures generated for each year may be updated to reflect improved processing methods, data availability, or changed administrative boundaries.
Woody vegetation clearing
See Statewide Landcover and Tree Study: woody vegetation clearing for details on how we capture woody vegetation clearing.
Long-term trends in woody vegetation clearing (1988 to present) have been available since 2006 through the Statewide Landcover and Tree Study (SLATS) program. Long-term trends in woody vegetation clearing are reported by converting the clearing area mapped in each image to an annual rate to accommodate variability caused by the different capture dates. This annualisation allows meaningful comparison of clearing between large regions of the state. However, using rates becomes less meaningful when examining much smaller areas – for example, clearing associated with individual approval areas.
The NSW Vegetation Clearing Report uses absolute hectares rather than reporting on annualised rates and only includes detected native forestry harvesting, not plantation harvesting. For information on annualised rates of plantation harvesting and native forestry harvesting, see Long term trends in woody vegetation clearing.
Non woody vegetation clearing
See Statewide Landcover and Tree Study: non woody vegetation clearing for details on how we capture non woody vegetation clearing.
Statewide Landcover and Tree Study non woody vegetation clearing has been captured since August 2017. Non woody clearing can be more difficult to detect than woody clearing, as full conversion of undisturbed areas to exotic pastures or cropping can take more than 12 months. Most non woody vegetation clearing can be confidently attributed in the year of mapping. Some areas of disturbance detected may be flagged for confirmation in the following mapping year. Consequently, the annual report makes an adjustment to the non woody clearing figure of the previous year.
Reporting on vegetation clearing in the state and on Category 2 regulated land
All vegetation clearing across the landscape is captured in statewide reporting, but a subset falls within what is known as Category 2 regulated land. The Local Land Services Act outlines land exempt under the Act (Category 1), land regulated under the Act (Category 2), and land excluded from regulation under the Act.
Category 1 is exempt land where native vegetation can be cleared without approval from Local Land Services.
Category 2 regulated land consists of either:
- land that may require authorisations under the Land Management (Native Vegetation) Code 2018 (referred to here as the Land Management Code)
- land considered sensitive or vulnerable, and therefore, any vegetation clearing is restricted.
New South Wales covers 80 million hectares (ha), of which around 47 million hectares or 59% are Category 2 regulated land.
The Native Vegetation Regulatory Map displays land categories under the Local Land Services Act across New South Wales. For more information, see Native Vegetation Regulatory Map.
Statewide vegetation clearing by landcover class
Landcover classes are assigned during the mapping process using visual cues and a range of ancillary data. The 3 landcover classes are:
- agriculture
- (native) forestry
- infrastructure.
In 2021 across the state, woody vegetation harvesting of native forestry has decreased (35%) since 2020, and woody vegetation clearing for agriculture has increased (15%).
Since 2018, 97% of non woody vegetation clearing has occurred for agriculture. Non woody vegetation clearing for agriculture has seen an average annual increase of approximately 5% between 2018 and 2020 (Figure 2). The outlined area in Figure 2 identifies areas of non woody clearing confirmed in the year following the initial reporting. For more information, see How is vegetation clearing captured and reported.
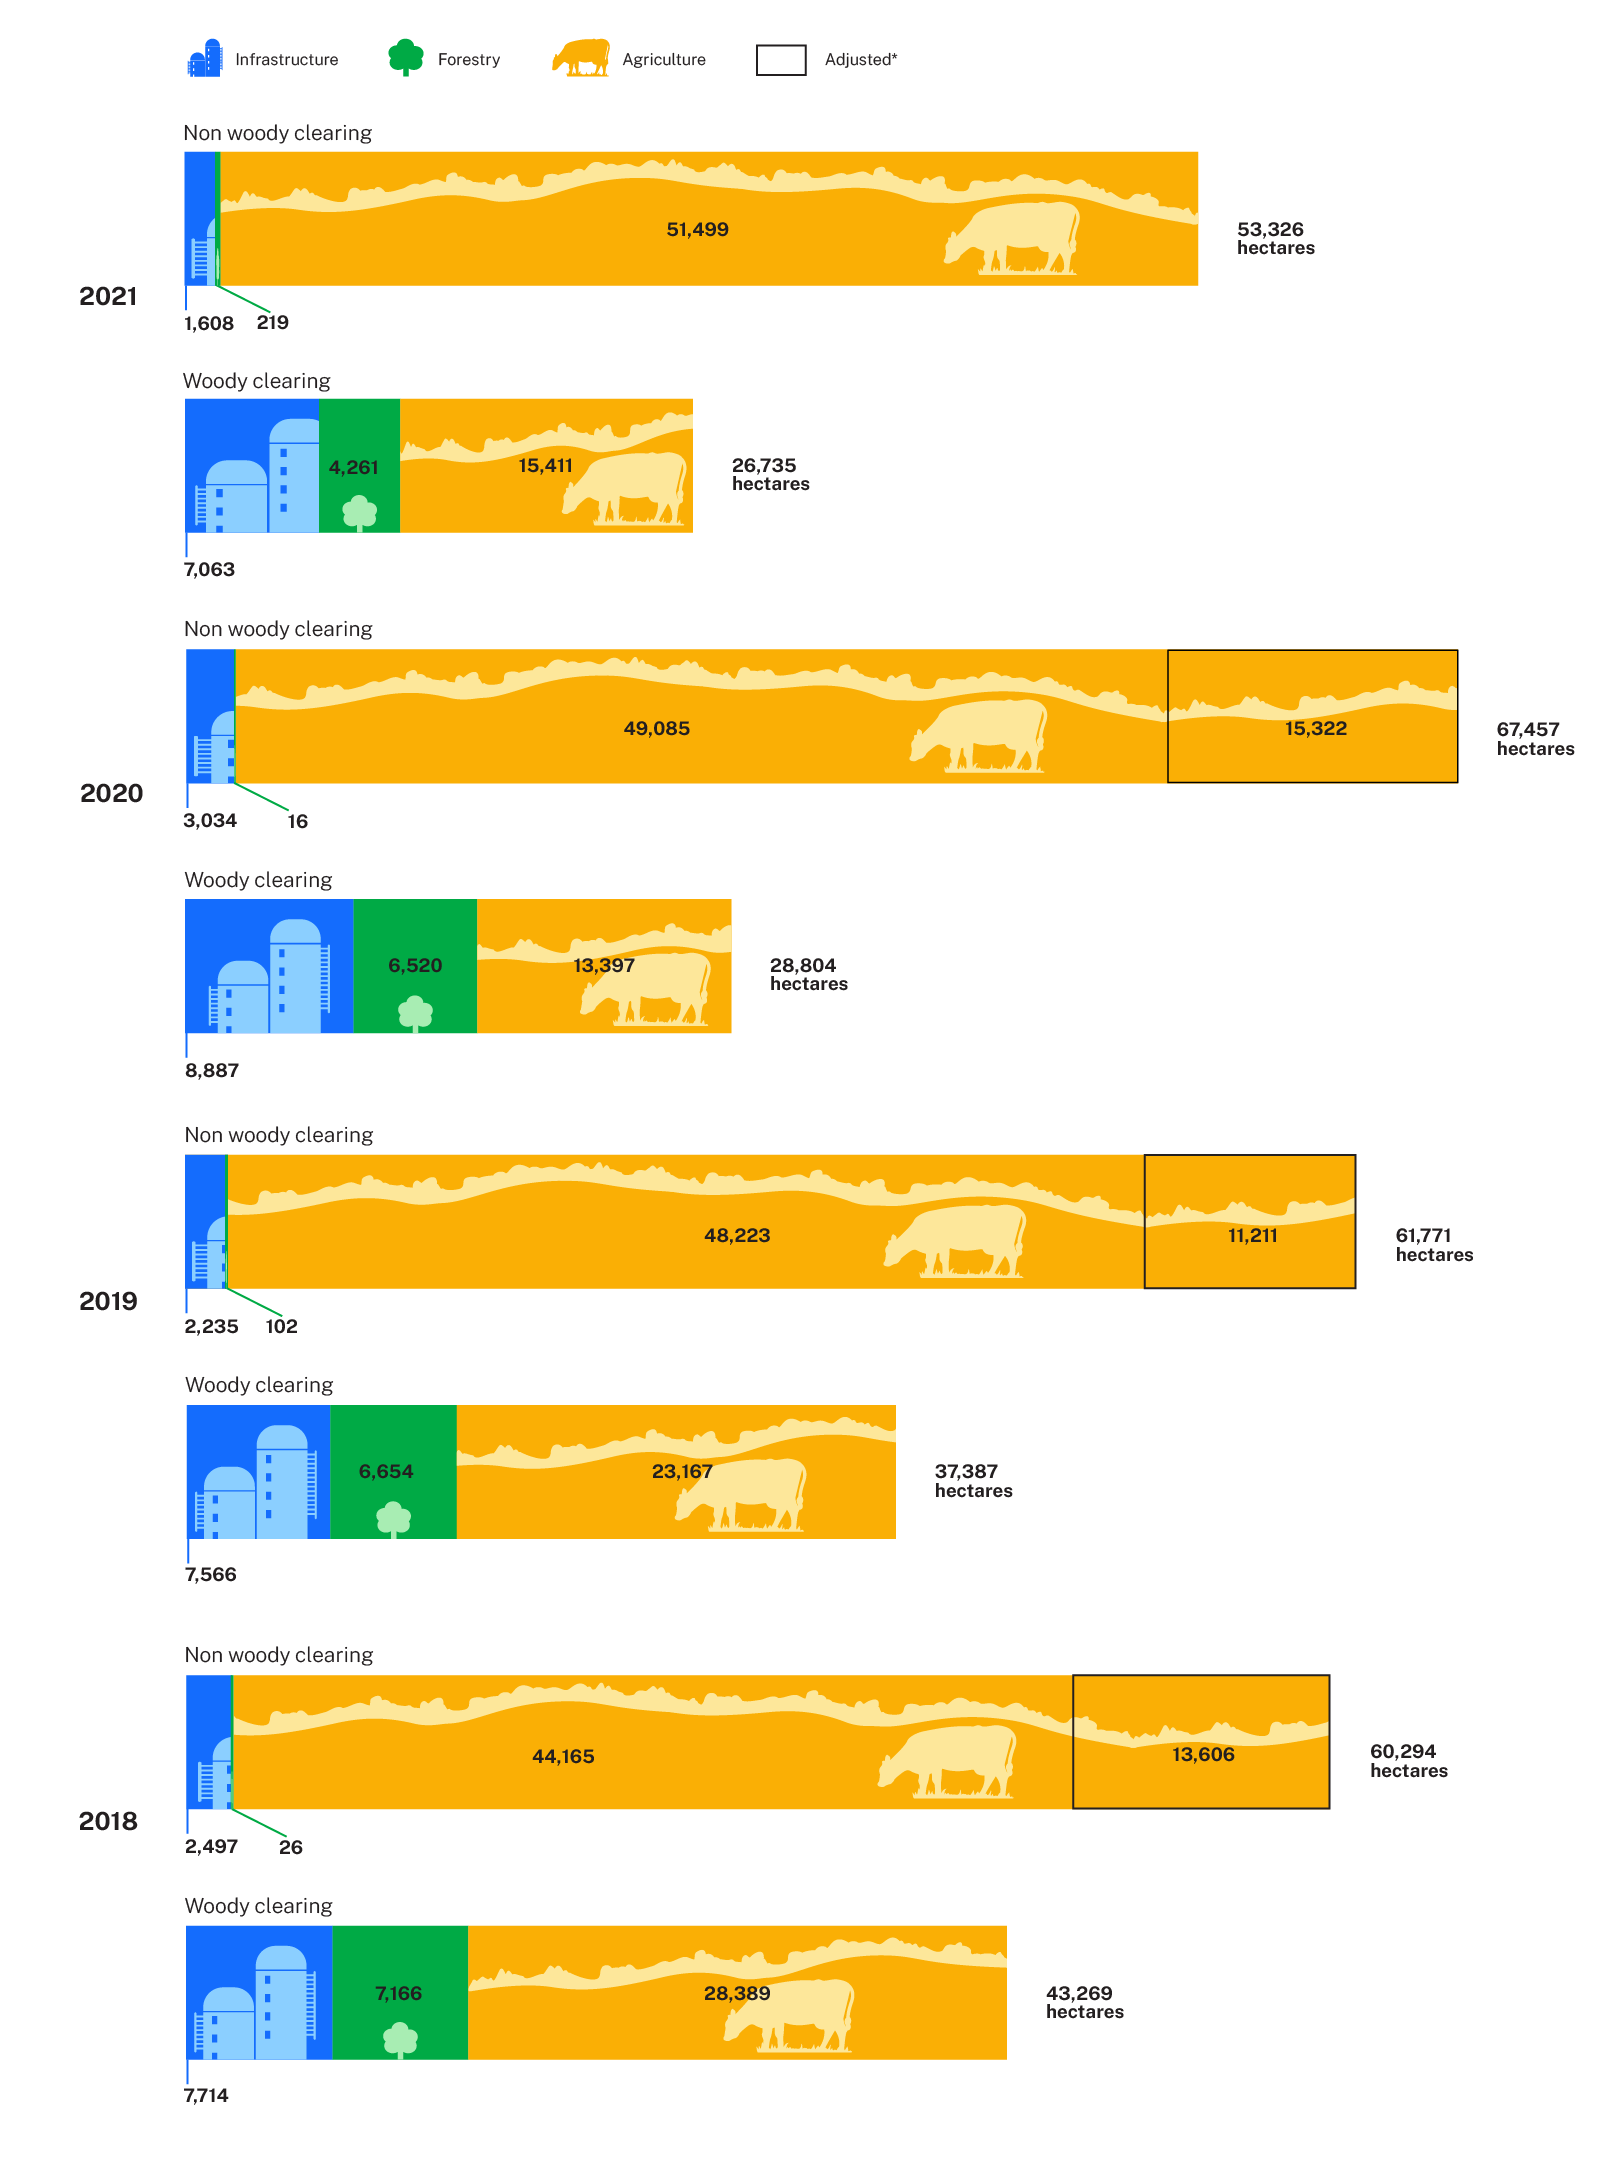
Figure 2: Clearing by landcover class 2018–21
Cumulative vegetation clearing 2018–21
The total area of vegetation cleared over the 4-year period across New South Wales from 2018–21 is 379,040 ha; 330,290 ha was on Category 2 Regulated land.
| Clearing type (ha)/land type | Woody | Non woody | Total |
|---|---|---|---|
| Category 2 Regulated Land | 106,540 | 223,750 | 330,290 |
| Other land | 29,650 | 19,100 | 48,750 |
| Total | 136,190 | 242,850 | 379,040 |
Figure 3 shows the cumulative area of clearing on Category 2 regulated land by Interim Biogeographic Regionalisation for Australia (IBRA). The Darling Riverine Plains and Cobar Peneplain are impacted by the greatest area of vegetation clearing from 2018–21.
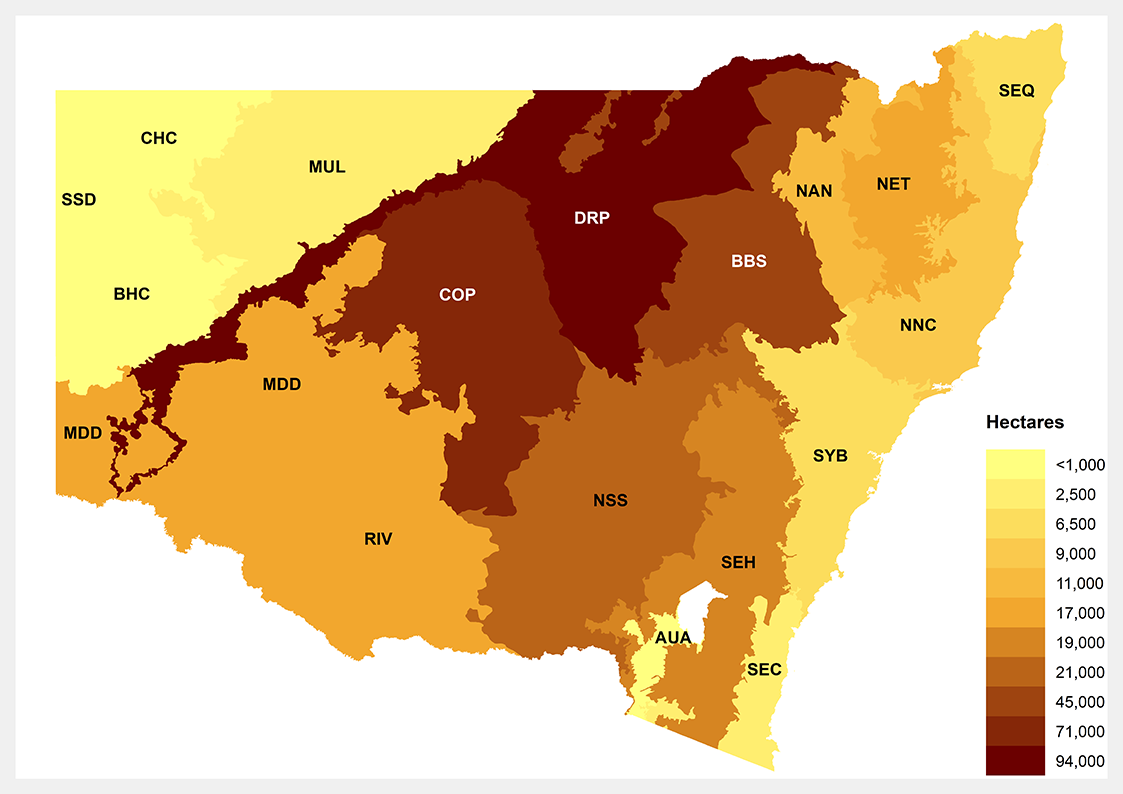
Figure 3: Cumulative clearing by Interim Biogeographic Regionalisation for Australia (IBRA) 2018–21 on Category 2 Regulated Land.
| Code | Description |
|---|---|
| AUA | Australian Alps |
| BBS | Brigalow Belt South |
| BHC | Broken Hill Complex |
| COP | Cobar Peneplain |
| DRP | Darling Riverine Plains |
| MDD | Murray Darling Depression |
| MUL | Mulga Lands |
| NAN | Nandewar |
| NET | New England Tablelands |
| NNC | NSW North Coast |
| NSS | New South Western Slopes |
| RIV | Riverina |
| SEC | South East Corner |
| SEH | South Eastern Highlands |
| SEQ | South Eastern Queensland |
| SSD | Simpson Strzelecki Dunefields |
| SYB | Sydney Basin |
Authorised and unallocated clearing on Category 2 regulated land
Vegetation clearing on Category 2 regulated land can be reported according to the authorising Act approvals (the Local Land Services Act or other relevant legislation, including the former Native Vegetation Act 2003), or as clearing that remains unallocated. Unallocated clearing is vegetation clearing for which the Department of Climate Change, Energy, the Environment and Water has not been able to identify a formal authorisation or is unable to presume authorised using visual cues in the imagery.
The method to analyse authorised and unallocated clearing involves comparing detected areas of vegetation clearing against all available spatial data for approvals. Visual cues in the imagery may also be used, to presume authorisation as allowable activities under the Local Land Services Act (for example, clearing for fence lines or dams) or other Acts (for example, urban expansion). No analysis of the characteristics of these activities has been undertaken to ensure they comply with specifications under the relevant Act.
Figure 4 shows vegetation clearing authorisations for 2021 split by woody and non woody vegetation structure. The non woody figures are preliminary as some additional non woody clearing events will be confirmed and added to 2021 in next year's clearing analysis. See How vegetation clearing is captured for more information.
Preliminary 2021 figures (see Figure 4) show, of the 72,335 ha of clearing detected on Category 2 regulated land, 39% of clearing was recorded as authorised or presumed authorised. Of this, 19% was authorised under the Local Land Services Act and 12% under the Native Vegetation Act 2003. A further 8% of clearing was presumed allowable under these Acts or authorised under other legislation.
The 61% of unallocated clearing is predominantly non woody vegetation clearing events (55%) compared to woody vegetation clearing events (6%). Unallocated clearing refers to:
- lawful clearing or reduction in landcover on Category 2 regulated land that does not require approval, notification and/or keeping of records
- vegetation loss for which the department does not have access to spatial records that authorise or allocate the clearing to a particular land management activity and which cannot be presumed from visual cues in the imagery
- areas that have been potentially cleared unlawfully or are not fully compliant with approvals.
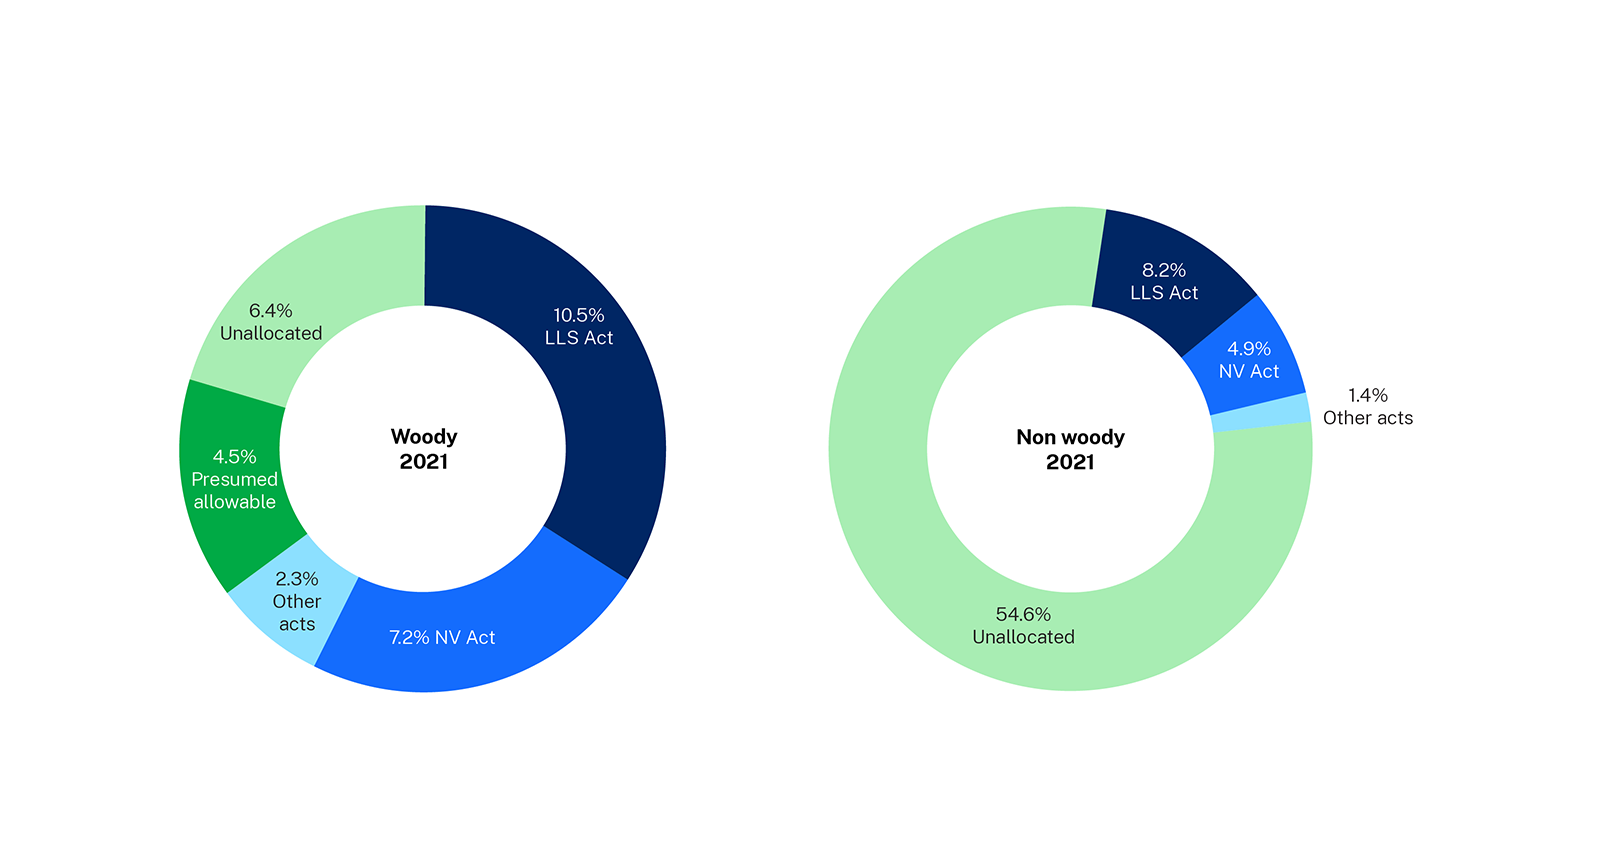
Figure 4: 2021 vegetation clearing by authorisation and structure
The land management framework gives landholders greater flexibility and discretion to undertake routine land management activities without seeking approval. Consequently, several options for clearing without specific approval are permissible under the current land management framework. These options include:
- provisions for landholders to remove native vegetation for routine farm management (allowable activities)
- land management activities under the Land Management Code that do not require certification or notification (managing woody native regrowth in managed native pastures)
- landholder self-assessment of the level of disturbance of grasslands or ground cover
- other legislative exceptions.
Analysis of 2018–20 vegetation clearing against the existing and new authorisation categories shows increased clearing under the Local Land Services Act and away from Native Vegetation Act approvals (Figure 5). Preliminary data for 2021 suggests a continuation of this trend. Each year approximately 4–5% of clearing is presumed allowable activities, and 4% authorised under other Acts.
Unallocated clearing has remained constant at 68% of total clearing between 2018 and 2020. In 2021, 61% of clearing was unallocated. This will increase with additional non woody clearing confirmed in the 2022 report.
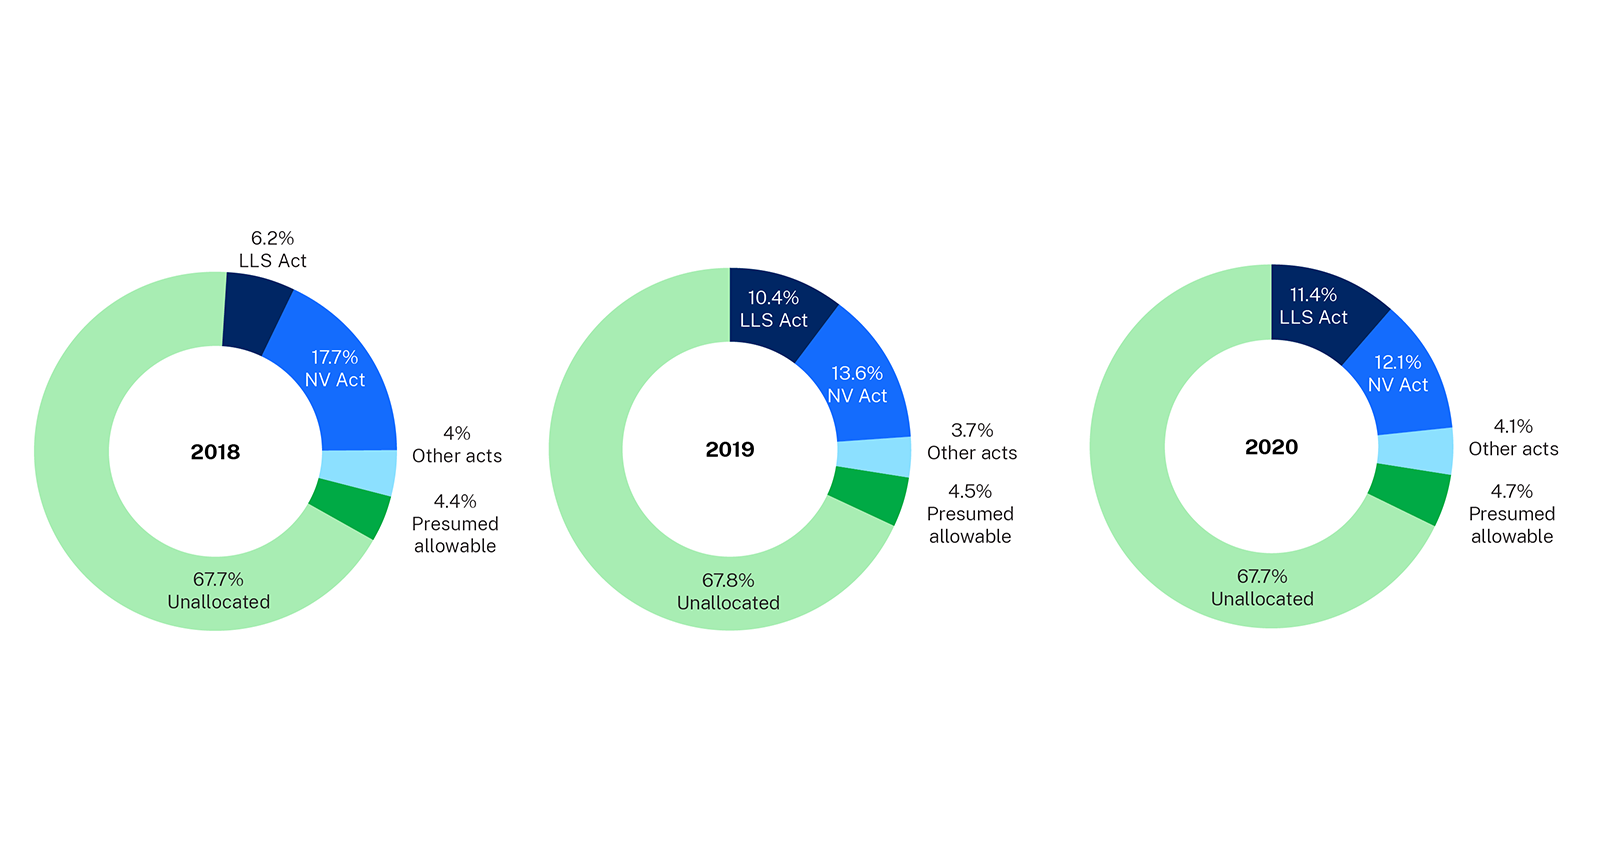
Figure 5: 2018–20 vegetation clearing by authorisation
Vegetation clearing authorised under the Local Land Services Act on Category 2 regulated land
Under the Local Land Services Act, the approval authorisations fall under Part 5A, Division 5 for clearing native vegetation under the Land Management Code, or Part 5B for private native forestry (PNF). Table 2 describes the authorisation types.
The Land Management Code authorises clearing of native vegetation on Category 2 regulated land, provides for establishment and management of set aside areas, and authorises re-categorisation of land.
The total cleared area increased from 9,483 ha in 2020 to 13,501 ha in 2021. Increased clearing occurred over 7 of the 15 types of authorisations (Figure 6). The largest total areas cleared under an approval were:
- Part 5.4 – Equity code, removing native vegetation from regulated rural areas. Clearing approvals under this code are required to establish set aside areas. In 2021, 4,724 ha were cleared, a 119% increase on 2020.
- Part 2.2 – Invasive native species, moderate impact clearing of invasive native species. In 2021, 4,566 ha were cleared, a 41% increase on 2020. Invasive native species management is intended to improve the local environment by removing some native plants that have reached very high densities, dominating an area. These activities promote the regeneration and regrowth of a more natural and diverse range of native vegetation.
- PNF – Private Native Forestry. The area harvested decreased by 20% from 2020 to 1,586 ha in 2021.
See below for descriptions of each of the authorisations under the Local Land Services Act.
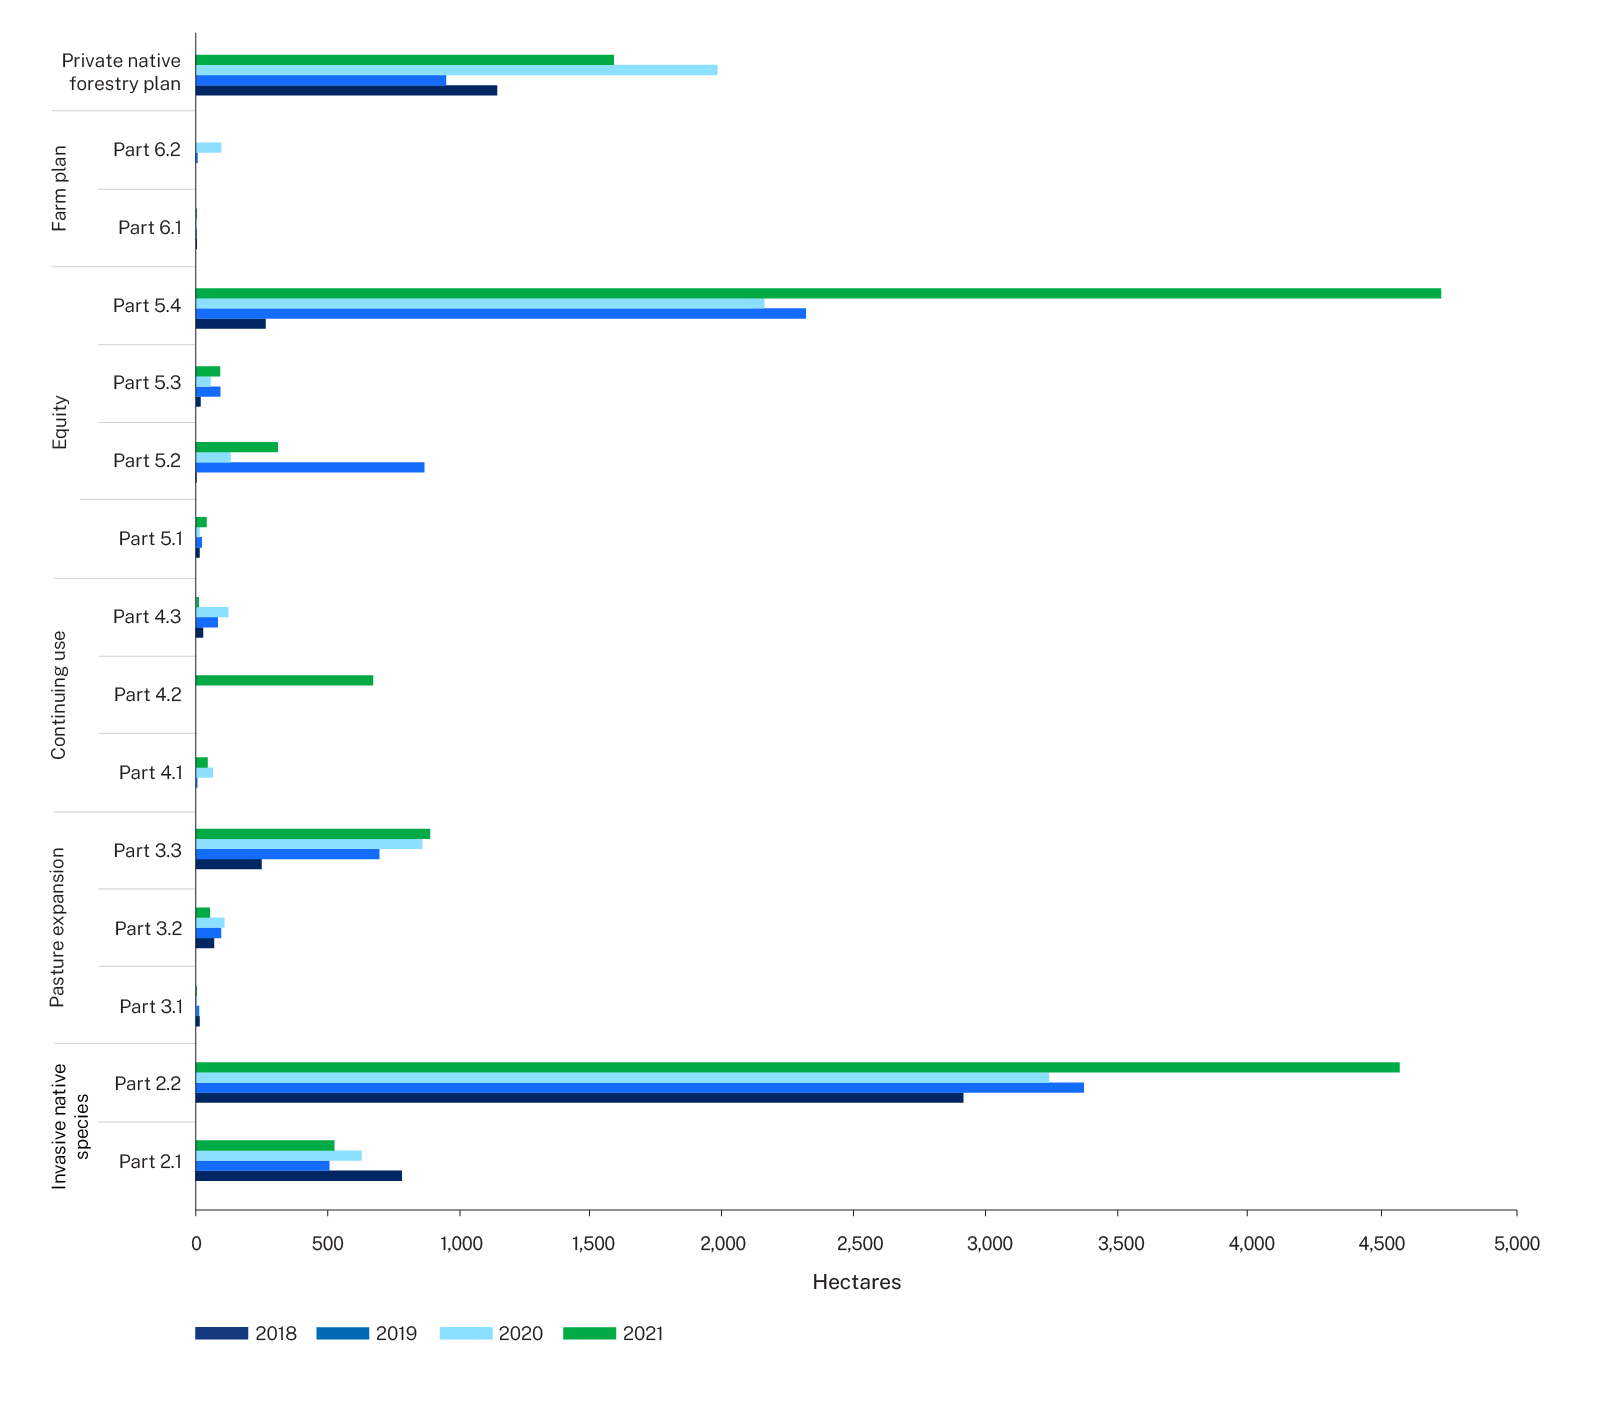
Figure 6: Authorised clearing under Part 5A of the Local Land Services Act, 2018 to 2021
| Authorisation | Description |
|---|---|
| INS Part 2.1 | Land Management Code Part 2 Invasive native species, Division 1 – low impact clearing of invasive native species |
| INS Part 2.2 | Land Management Code Part 2 Invasive native species, Division 2 – moderate impact clearing of invasive native species |
| Pasture Expansion Part 3.1 | Land Management Code Part 3 Pasture expansion, Division 1 – uniform thinning of woody native vegetation (notification) |
| Pasture Expansion Part 3.2 | Land Management Code Part 3 Pasture expansion, Division 2 – uniform thinning of woody native vegetation (certification) |
| Pasture Expansion Part 3.3 | Land Management Code Part 3 Pasture expansion, Division 3 – mosaic thinning of woody native vegetation |
| Continuing use Part 4.1 | Land Management Code Part 4 Continuing use, Division 1 – managing woody native regrowth in managed native pastures |
| Continuing use Part 4.2 | Land Management Code Part 4 Continuing use, Division 2 – continuation of land management activities undertaken after 1990 |
| Continuing use Part 4.3 | Land Management Code Part 4 Continuing use, Division 3 – continuation of rotational activity undertaken before 1990 |
| Equity Part 5.1 | Land Management Code Part 5 Equity, Division 1 – removing native vegetation from paddock tree areas |
| Equity Part 5. 2 | Land Management Code Part 5 Equity, Division 2 – clearing compromised native ground cover |
| Equity Part 5.3 | Land Management Code Part 5 Equity, Division 3 – removing native vegetation from small areas |
| Equity Part 5.4 | Land Management Code Part 5 Equity, Division 4 – removing native vegetation from regulated rural areas |
| Farm Plan Part 6.1 | Land Management Code Part 6 Farm plan, Division 1 – removing native vegetation from paddock tree areas |
| Farm Plan Part 6.2 | Land Management Code Part 6 Farm Plan, Division 2 – removing native vegetation from regulated rural areas |
| Private native forestry (PNF) plan | PNF plans under Part 5B of the Local Land Services Act |
Vegetation clearing authorised under the Native Vegetation Act on Category 2 regulated land
Authorisations under the Native Vegetation Act are described in Table 3.
Clearing under Native Vegetation Act approvals decreased by 13% between the 2020 and 2021 (Figure 7). The largest areas cleared under approvals were:
- Management of invasive native species (INS) that improves or maintains environmental outcomes under a property vegetation plan (PVP INS) and under a ministerial order (INS MO) at a total of 7,716 ha in 2021. Invasive native species clearing accounted for 88% of implemented clearing under the Native Vegetation Act.
- Clearing regrowth under a property vegetation plan (PVP continuing use) was 591 ha, an 87% increase on 2020.
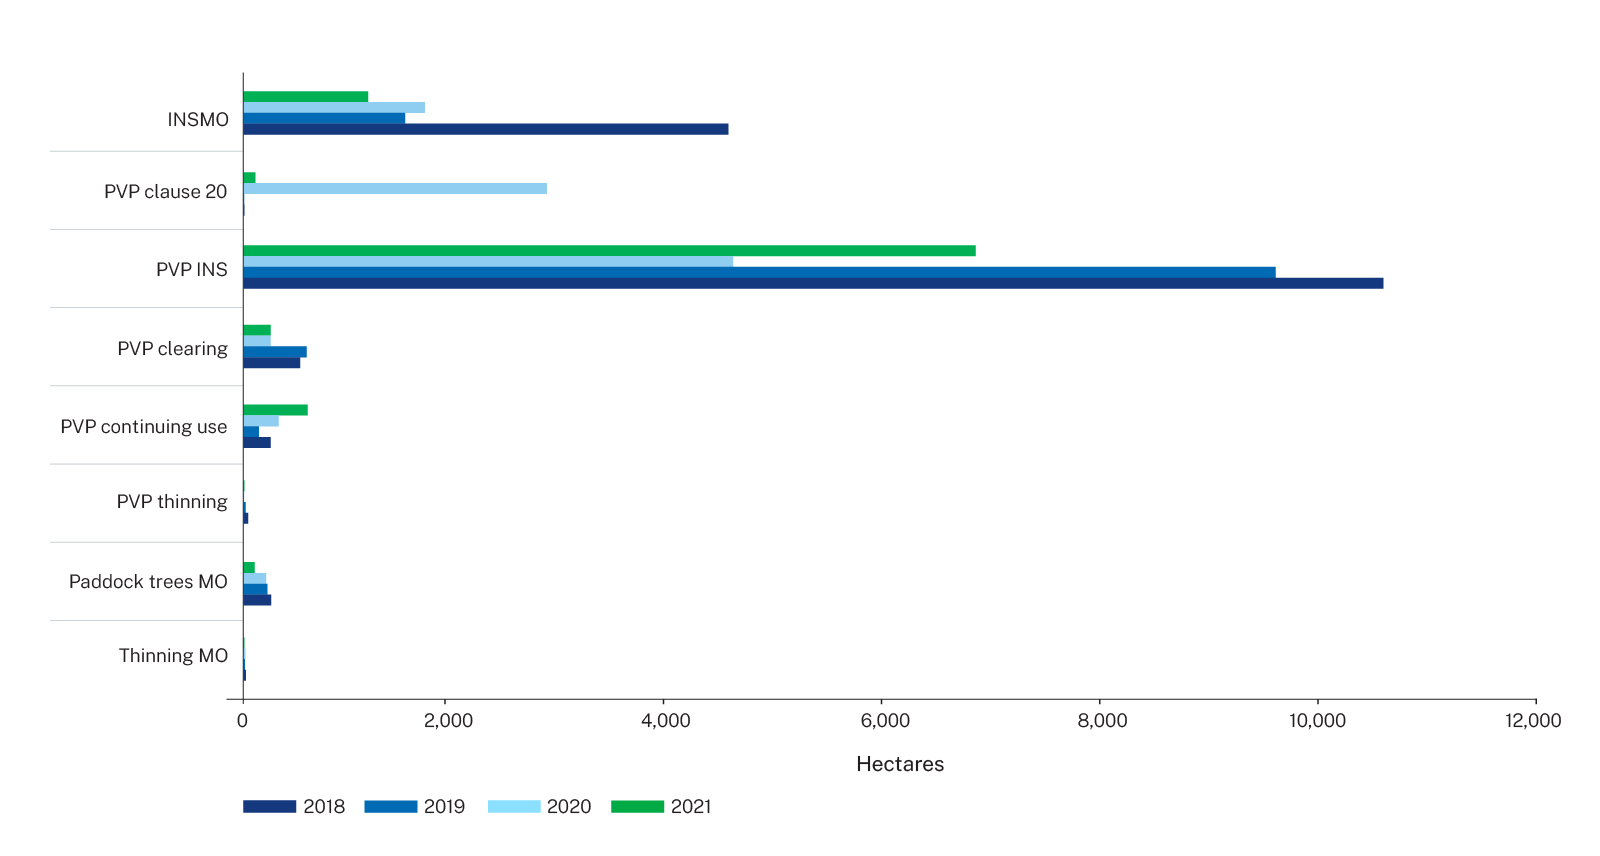
Figure 7: Authorised clearing under the Native Vegetation Act in the 4 years to 2021
| Authorisation | Description |
|---|---|
| Invasive native species, Ministerial Order (MO) | Routine agricultural management activity for the management of invasive native species under an MO |
| Property vegetation plan (PVP) clause 20 | Clearing for conservation or long-term environmental benefit under clause 20 in accordance with a PVP |
| PVP invasive native species (INS) | Management of invasive native species that improves or maintains environmental outcomes under a PVP |
| PVP clearing | Broadscale clearing that improves or maintains environmental outcomes under a PVP |
| PVP continuing use | Clearing of regrowth authorised under a PVP |
| PVP thinning | Ecological thinning of vegetation that improves or maintains environmental outcomes under a PVP |
| Paddock trees MO | Routine agricultural management activity for the clearing of paddock trees under an MO |
| Thinning MO | Routine agricultural management activity for the ecological thinning of vegetation under an MO |